

Electron Momentum Distribution Around Vacancy Cluster …
453
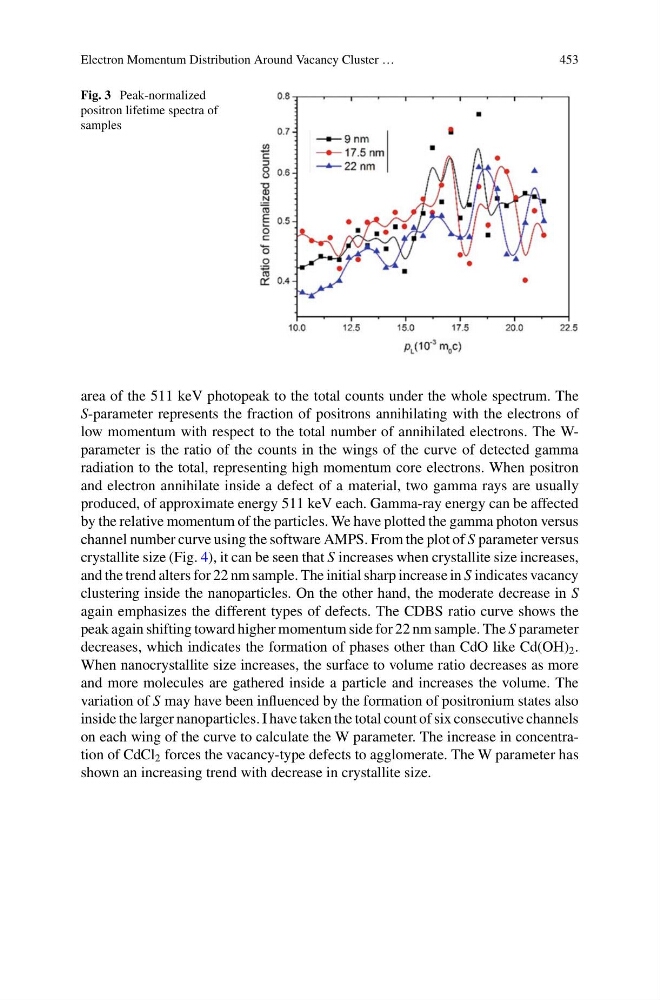
Fig. 3 Peak-normalized
positron lifetime spectra of
samples
area of the 511 keV photopeak to the total counts under the whole spectrum. The
S-parameter represents the fraction of positrons annihilating with the electrons of
low momentum with respect to the total number of annihilated electrons. The Wparameter is the ratio of the counts in the wings of the curve of detected gamma
radiation to the total, representing high momentum core electrons. When positron
and electron annihilate inside a defect of a material, two gamma rays are usually
produced, of approximate energy 511 keV each. Gamma-ray energy can be affected
by the relative momentum of the particles. We have plotted the gamma photon versus
channel number curve using the software AMPS. From the plot of S parameter versus
crystallite size (Fig. 4), it can be seen that S increases when crystallite size increases,
and the trend alters for 22 nm sample. The initial sharp increase in S indicates vacancy
clustering inside the nanoparticles. On the other hand, the moderate decrease in S
again emphasizes the different types of defects. The CDBS ratio curve shows the
peak again shifting toward higher momentum side for 22 nm sample. The S parameter
decreases, which indicates the formation of phases other than CdO like Cd(OH) 2 .
When nanocrystallite size increases, the surface to volume ratio decreases as more
and more molecules are gathered inside a particle and increases the volume. The
variation of S may have been influenced by the formation of positronium states also
inside the larger nanoparticles. I have taken the total count of six consecutive channels
on each wing of the curve to calculate the W parameter. The increase in concentration of CdCl 2 forces the vacancy-type defects to agglomerate. The W parameter has
shown an increasing trend with decrease in crystallite size.
453
Fig. 3 Peak-normalized
positron lifetime spectra of
samples
area of the 511 keV photopeak to the total counts under the whole spectrum. The
S-parameter represents the fraction of positrons annihilating with the electrons of
low momentum with respect to the total number of annihilated electrons. The Wparameter is the ratio of the counts in the wings of the curve of detected gamma
radiation to the total, representing high momentum core electrons. When positron
and electron annihilate inside a defect of a material, two gamma rays are usually
produced, of approximate energy 511 keV each. Gamma-ray energy can be affected
by the relative momentum of the particles. We have plotted the gamma photon versus
channel number curve using the software AMPS. From the plot of S parameter versus
crystallite size (Fig. 4), it can be seen that S increases when crystallite size increases,
and the trend alters for 22 nm sample. The initial sharp increase in S indicates vacancy
clustering inside the nanoparticles. On the other hand, the moderate decrease in S
again emphasizes the different types of defects. The CDBS ratio curve shows the
peak again shifting toward higher momentum side for 22 nm sample. The S parameter
decreases, which indicates the formation of phases other than CdO like Cd(OH) 2 .
When nanocrystallite size increases, the surface to volume ratio decreases as more
and more molecules are gathered inside a particle and increases the volume. The
variation of S may have been influenced by the formation of positronium states also
inside the larger nanoparticles. I have taken the total count of six consecutive channels
on each wing of the curve to calculate the W parameter. The increase in concentration of CdCl 2 forces the vacancy-type defects to agglomerate. The W parameter has
shown an increasing trend with decrease in crystallite size.