

452
A. Das
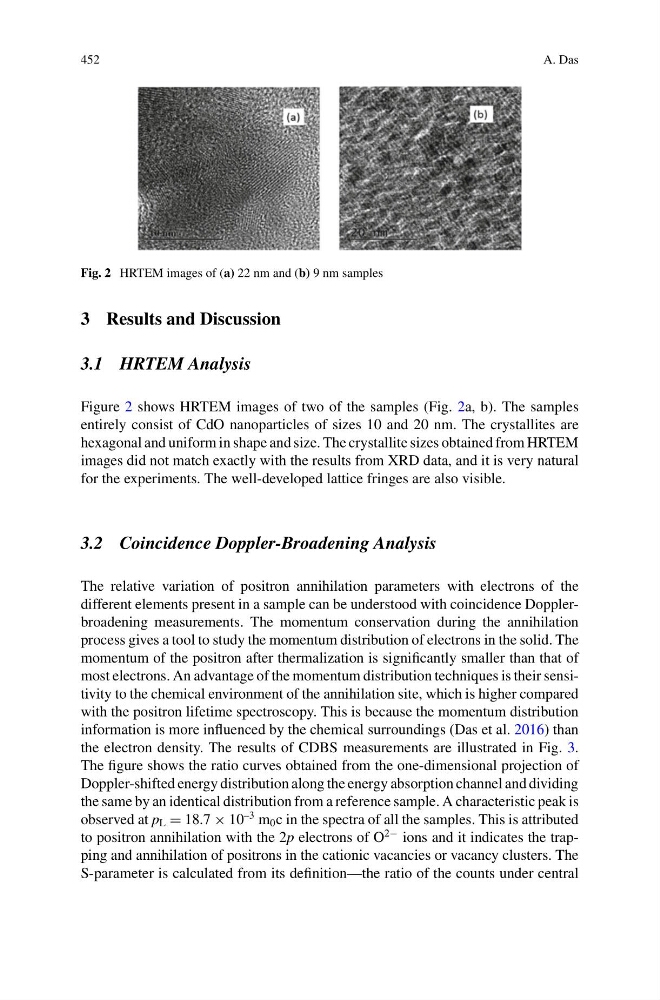
Fig. 2 HRTEM images of (a) 22 nm and (b) 9 nm samples
3 Results and Discussion
3.1 HRTEM Analysis
Figure 2 shows HRTEM images of two of the samples (Fig. 2a, b). The samples
entirely consist of CdO nanoparticles of sizes 10 and 20 nm. The crystallites are
hexagonal and uniform in shape and size. The crystallite sizes obtained from HRTEM
images did not match exactly with the results from XRD data, and it is very natural
for the experiments. The well-developed lattice fringes are also visible.
3.2 Coincidence Doppler-Broadening Analysis
The relative variation of positron annihilation parameters with electrons of the
different elements present in a sample can be understood with coincidence Dopplerbroadening measurements. The momentum conservation during the annihilation
process gives a tool to study the momentum distribution of electrons in the solid. The
momentum of the positron after thermalization is significantly smaller than that of
most electrons. An advantage of the momentum distribution techniques is their sensitivity to the chemical environment of the annihilation site, which is higher compared
with the positron lifetime spectroscopy. This is because the momentum distribution
information is more influenced by the chemical surroundings (Das et al. 2016) than
the electron density. The results of CDBS measurements are illustrated in Fig. 3.
The figure shows the ratio curves obtained from the one-dimensional projection of
Doppler-shifted energy distribution along the energy absorption channel and dividing
the same by an identical distribution from a reference sample. A characteristic peak is
observed at p L = 18.7 × 10
–3 m 0 c in the spectra of all the samples. This is attributed
to positron annihilation with the 2p electrons of O
2− ions and it indicates the trapping and annihilation of positrons in the cationic vacancies or vacancy clusters. The
S-parameter is calculated from its definition—the ratio of the counts under central
A. Das
Fig. 2 HRTEM images of (a) 22 nm and (b) 9 nm samples
3 Results and Discussion
3.1 HRTEM Analysis
Figure 2 shows HRTEM images of two of the samples (Fig. 2a, b). The samples
entirely consist of CdO nanoparticles of sizes 10 and 20 nm. The crystallites are
hexagonal and uniform in shape and size. The crystallite sizes obtained from HRTEM
images did not match exactly with the results from XRD data, and it is very natural
for the experiments. The well-developed lattice fringes are also visible.
3.2 Coincidence Doppler-Broadening Analysis
The relative variation of positron annihilation parameters with electrons of the
different elements present in a sample can be understood with coincidence Dopplerbroadening measurements. The momentum conservation during the annihilation
process gives a tool to study the momentum distribution of electrons in the solid. The
momentum of the positron after thermalization is significantly smaller than that of
most electrons. An advantage of the momentum distribution techniques is their sensitivity to the chemical environment of the annihilation site, which is higher compared
with the positron lifetime spectroscopy. This is because the momentum distribution
information is more influenced by the chemical surroundings (Das et al. 2016) than
the electron density. The results of CDBS measurements are illustrated in Fig. 3.
The figure shows the ratio curves obtained from the one-dimensional projection of
Doppler-shifted energy distribution along the energy absorption channel and dividing
the same by an identical distribution from a reference sample. A characteristic peak is
observed at p L = 18.7 × 10
–3 m 0 c in the spectra of all the samples. This is attributed
to positron annihilation with the 2p electrons of O
2− ions and it indicates the trapping and annihilation of positrons in the cationic vacancies or vacancy clusters. The
S-parameter is calculated from its definition—the ratio of the counts under central