

346
B. Chakraborty et al.
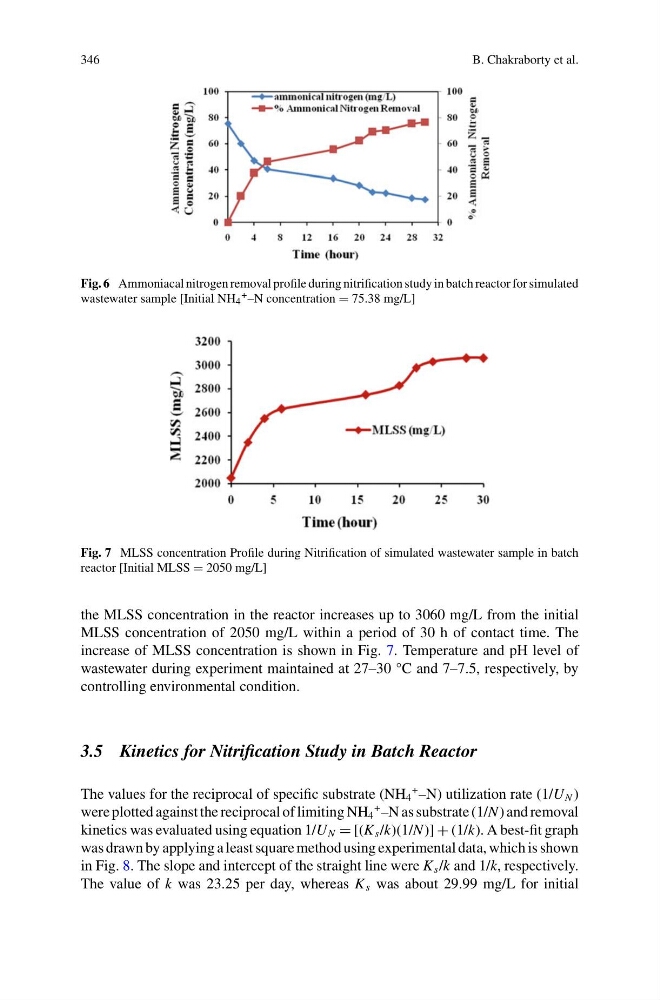
Fig. 6 Ammoniacal nitrogen removal profile during nitrification study in batch reactor for simulated
wastewater sample [Initial NH 4
+ –N concentration = 75.38 mg/L]
Fig. 7 MLSS concentration Profile during Nitrification of simulated wastewater sample in batch
reactor [Initial MLSS = 2050 mg/L]
the MLSS concentration in the reactor increases up to 3060 mg/L from the initial
MLSS concentration of 2050 mg/L within a period of 30 h of contact time. The
increase of MLSS concentration is shown in Fig. 7. Temperature and pH level of
wastewater during experiment maintained at 27–30 °C and 7–7.5, respectively, by
controlling environmental condition.
3.5 Kinetics for Nitrification Study in Batch Reactor
The values for the reciprocal of specific substrate (NH 4
+ –N) utilization rate (1/U N )
were plotted against the reciprocal of limiting NH 4
+ –N as substrate (1/N) and removal
kinetics was evaluated using equation 1/U N = [(K s /k)(1/N)] + (1/k). A best-fit graph
was drawn by applying a least square method using experimental data, which is shown
in Fig. 8. The slope and intercept of the straight line were K s /k and 1/k, respectively.
The value of k was 23.25 per day, whereas K s was about 29.99 mg/L for initial
B. Chakraborty et al.
Fig. 6 Ammoniacal nitrogen removal profile during nitrification study in batch reactor for simulated
wastewater sample [Initial NH 4
+ –N concentration = 75.38 mg/L]
Fig. 7 MLSS concentration Profile during Nitrification of simulated wastewater sample in batch
reactor [Initial MLSS = 2050 mg/L]
the MLSS concentration in the reactor increases up to 3060 mg/L from the initial
MLSS concentration of 2050 mg/L within a period of 30 h of contact time. The
increase of MLSS concentration is shown in Fig. 7. Temperature and pH level of
wastewater during experiment maintained at 27–30 °C and 7–7.5, respectively, by
controlling environmental condition.
3.5 Kinetics for Nitrification Study in Batch Reactor
The values for the reciprocal of specific substrate (NH 4
+ –N) utilization rate (1/U N )
were plotted against the reciprocal of limiting NH 4
+ –N as substrate (1/N) and removal
kinetics was evaluated using equation 1/U N = [(K s /k)(1/N)] + (1/k). A best-fit graph
was drawn by applying a least square method using experimental data, which is shown
in Fig. 8. The slope and intercept of the straight line were K s /k and 1/k, respectively.
The value of k was 23.25 per day, whereas K s was about 29.99 mg/L for initial