

Kinetics Study of a Suspended Growth System for Biological …
345
Table 3 Values of kinetic constants for carbon oxidation study
Serial number Kinetic coefficients Values from present study Typical kinetic coefficient for
municipal wastewater
(Metcalf and Eddy Inc. 2000)
1
Y
0.765
0.4–0.8
2
K d
0.056
0.025–0.075
3
K
9.09
2–10
4
k s
350.69
25–100
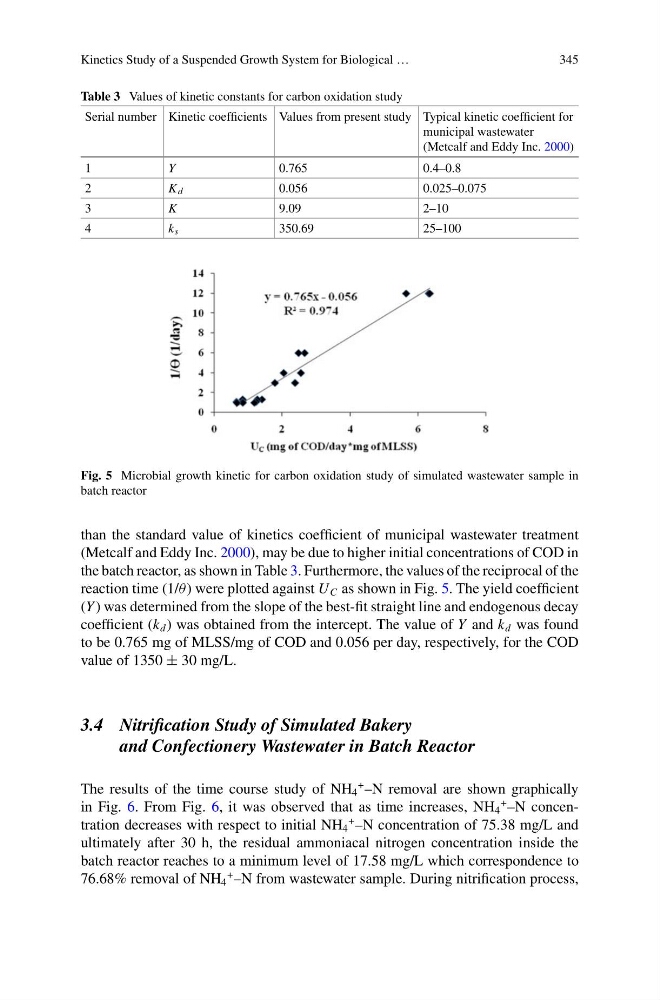
Fig. 5 Microbial growth kinetic for carbon oxidation study of simulated wastewater sample in
batch reactor
than the standard value of kinetics coefficient of municipal wastewater treatment
(Metcalf and Eddy Inc. 2000), may be due to higher initial concentrations of COD in
the batch reactor, as shown in Table 3. Furthermore, the values of the reciprocal of the
reaction time (1/θ ) were plotted against U C as shown in Fig. 5. The yield coefficient
(Y ) was determined from the slope of the best-fit straight line and endogenous decay
coefficient (k d ) was obtained from the intercept. The value of Y and k d was found
to be 0.765 mg of MLSS/mg of COD and 0.056 per day, respectively, for the COD
value of 1350 ± 30 mg/L.
3.4 Nitrification Study of Simulated Bakery
and Confectionery Wastewater in Batch Reactor
The results of the time course study of NH 4
+ –N removal are shown graphically
in Fig. 6. From Fig. 6, it was observed that as time increases, NH 4
+ –N concentration decreases with respect to initial NH 4
+ –N concentration of 75.38 mg/L and
ultimately after 30 h, the residual ammoniacal nitrogen concentration inside the
batch reactor reaches to a minimum level of 17.58 mg/L which correspondence to
76.68% removal of NH 4
+ –N from wastewater sample. During nitrification process,
345
Table 3 Values of kinetic constants for carbon oxidation study
Serial number Kinetic coefficients Values from present study Typical kinetic coefficient for
municipal wastewater
(Metcalf and Eddy Inc. 2000)
1
Y
0.765
0.4–0.8
2
K d
0.056
0.025–0.075
3
K
9.09
2–10
4
k s
350.69
25–100
Fig. 5 Microbial growth kinetic for carbon oxidation study of simulated wastewater sample in
batch reactor
than the standard value of kinetics coefficient of municipal wastewater treatment
(Metcalf and Eddy Inc. 2000), may be due to higher initial concentrations of COD in
the batch reactor, as shown in Table 3. Furthermore, the values of the reciprocal of the
reaction time (1/θ ) were plotted against U C as shown in Fig. 5. The yield coefficient
(Y ) was determined from the slope of the best-fit straight line and endogenous decay
coefficient (k d ) was obtained from the intercept. The value of Y and k d was found
to be 0.765 mg of MLSS/mg of COD and 0.056 per day, respectively, for the COD
value of 1350 ± 30 mg/L.
3.4 Nitrification Study of Simulated Bakery
and Confectionery Wastewater in Batch Reactor
The results of the time course study of NH 4
+ –N removal are shown graphically
in Fig. 6. From Fig. 6, it was observed that as time increases, NH 4
+ –N concentration decreases with respect to initial NH 4
+ –N concentration of 75.38 mg/L and
ultimately after 30 h, the residual ammoniacal nitrogen concentration inside the
batch reactor reaches to a minimum level of 17.58 mg/L which correspondence to
76.68% removal of NH 4
+ –N from wastewater sample. During nitrification process,