

262
S. Chatterjee et al.
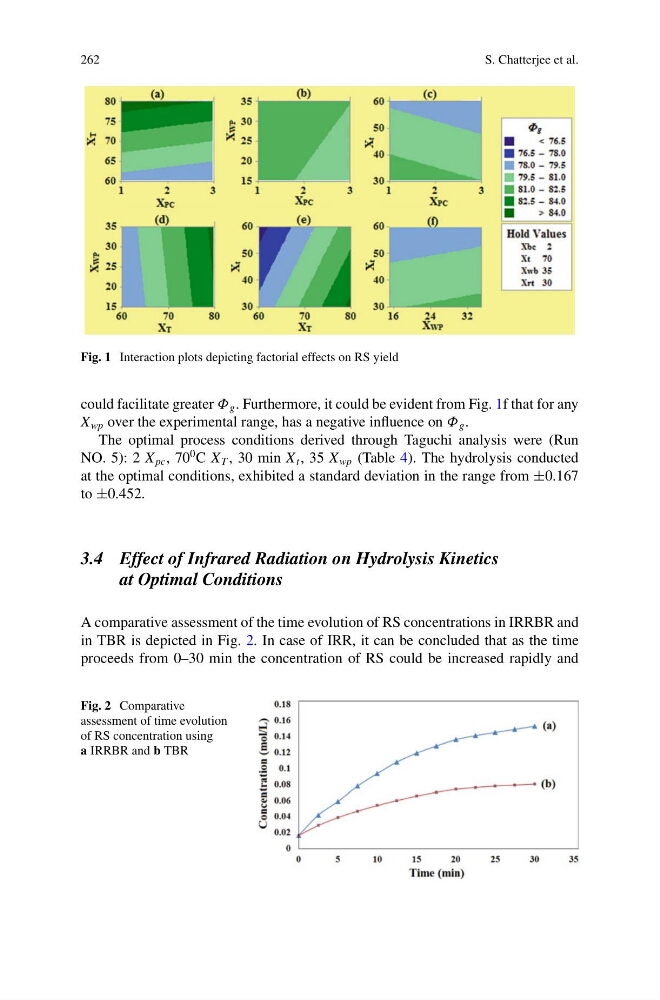
Fig. 1 Interaction plots depicting factorial effects on RS yield
could facilitate greater Φ g . Furthermore, it could be evident from Fig. 1f that for any
X wp over the experimental range, has a negative influence on Φ g .
The optimal process conditions derived through Taguchi analysis were (Run
NO. 5): 2 X pc , 70
0 C X T , 30 min X t , 35 X wp (Table 4). The hydrolysis conducted
at the optimal conditions, exhibited a standard deviation in the range from ±0.167
to ±0.452.
3.4 Effect of Infrared Radiation on Hydrolysis Kinetics
at Optimal Conditions
A comparative assessment of the time evolution of RS concentrations in IRRBR and
in TBR is depicted in Fig. 2. In case of IRR, it can be concluded that as the time
proceeds from 0–30 min the concentration of RS could be increased rapidly and
Fig. 2 Comparative
assessment of time evolution
of RS concentration using
a IRRBR and b TBR
S. Chatterjee et al.
Fig. 1 Interaction plots depicting factorial effects on RS yield
could facilitate greater Φ g . Furthermore, it could be evident from Fig. 1f that for any
X wp over the experimental range, has a negative influence on Φ g .
The optimal process conditions derived through Taguchi analysis were (Run
NO. 5): 2 X pc , 70
0 C X T , 30 min X t , 35 X wp (Table 4). The hydrolysis conducted
at the optimal conditions, exhibited a standard deviation in the range from ±0.167
to ±0.452.
3.4 Effect of Infrared Radiation on Hydrolysis Kinetics
at Optimal Conditions
A comparative assessment of the time evolution of RS concentrations in IRRBR and
in TBR is depicted in Fig. 2. In case of IRR, it can be concluded that as the time
proceeds from 0–30 min the concentration of RS could be increased rapidly and
Fig. 2 Comparative
assessment of time evolution
of RS concentration using
a IRRBR and b TBR