

Optimization of Energy-Proficient Infrared Radiated Rapid Hydrolysis …
261
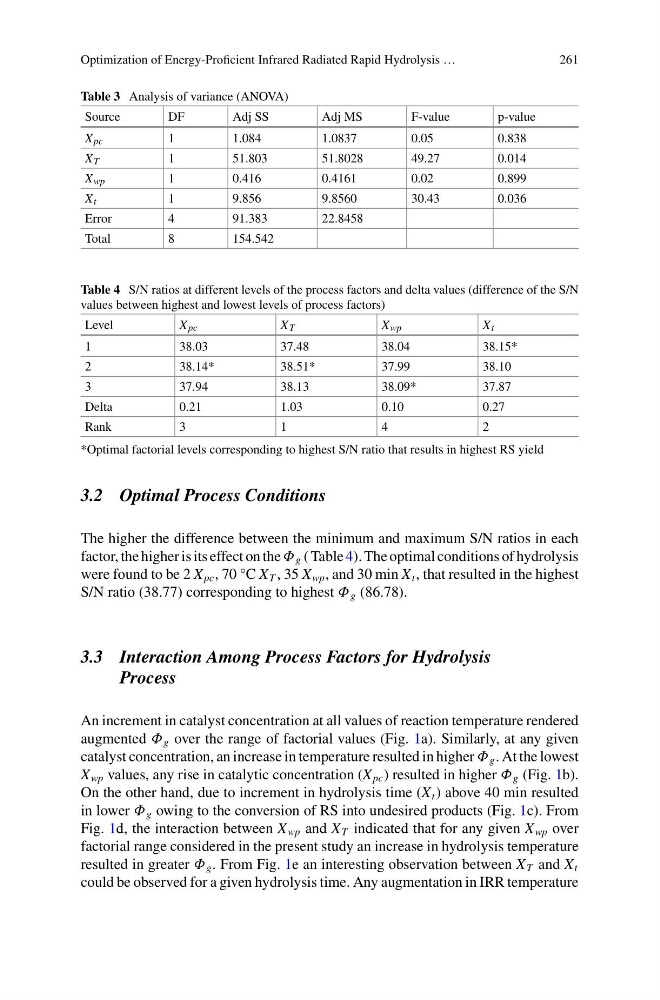
Table 3 Analysis of variance (ANOVA)
Source
DF
Adj SS
Adj MS
F-value
p-value
X pc
1
1.084
1.0837
0.05
0.838
X T
1
51.803
51.8028
49.27
0.014
X wp
1
0.416
0.4161
0.02
0.899
X t
1
9.856
9.8560
30.43
0.036
Error
4
91.383
22.8458
Total
8
154.542
Table 4 S/N ratios at different levels of the process factors and delta values (difference of the S/N
values between highest and lowest levels of process factors)
Level
X pc
X T
X wp
X t
1
38.03
37.48
38.04
38.15*
2
38.14*
38.51*
37.99
38.10
3
37.94
38.13
38.09*
37.87
Delta
0.21
1.03
0.10
0.27
Rank
3
1
4
2
*Optimal factorial levels corresponding to highest S/N ratio that results in highest RS yield
3.2 Optimal Process Conditions
The higher the difference between the minimum and maximum S/N ratios in each
factor, the higher is its effect on the Φ g ( Table 4). The optimal conditions of hydrolysis
were found to be 2 X pc , 70 °C X T , 35 X wp , and 30 min X t , that resulted in the highest
S/N ratio (38.77) corresponding to highest Φ g (86.78).
3.3 Interaction Among Process Factors for Hydrolysis
Process
An increment in catalyst concentration at all values of reaction temperature rendered
augmented Φ g over the range of factorial values (Fig. 1a). Similarly, at any given
catalyst concentration, an increase in temperature resulted in higher Φ g . At the lowest
X wp values, any rise in catalytic concentration (X pc ) resulted in higher Φ g (Fig. 1b).
On the other hand, due to increment in hydrolysis time (X t ) above 40 min resulted
in lower Φ g owing to the conversion of RS into undesired products (Fig. 1c). From
Fig. 1d, the interaction between X wp and X T indicated that for any given X wp over
factorial range considered in the present study an increase in hydrolysis temperature
resulted in greater Φ g . From Fig. 1e an interesting observation between X T and X t
could be observed for a given hydrolysis time. Any augmentation in IRR temperature
261
Table 3 Analysis of variance (ANOVA)
Source
DF
Adj SS
Adj MS
F-value
p-value
X pc
1
1.084
1.0837
0.05
0.838
X T
1
51.803
51.8028
49.27
0.014
X wp
1
0.416
0.4161
0.02
0.899
X t
1
9.856
9.8560
30.43
0.036
Error
4
91.383
22.8458
Total
8
154.542
Table 4 S/N ratios at different levels of the process factors and delta values (difference of the S/N
values between highest and lowest levels of process factors)
Level
X pc
X T
X wp
X t
1
38.03
37.48
38.04
38.15*
2
38.14*
38.51*
37.99
38.10
3
37.94
38.13
38.09*
37.87
Delta
0.21
1.03
0.10
0.27
Rank
3
1
4
2
*Optimal factorial levels corresponding to highest S/N ratio that results in highest RS yield
3.2 Optimal Process Conditions
The higher the difference between the minimum and maximum S/N ratios in each
factor, the higher is its effect on the Φ g ( Table 4). The optimal conditions of hydrolysis
were found to be 2 X pc , 70 °C X T , 35 X wp , and 30 min X t , that resulted in the highest
S/N ratio (38.77) corresponding to highest Φ g (86.78).
3.3 Interaction Among Process Factors for Hydrolysis
Process
An increment in catalyst concentration at all values of reaction temperature rendered
augmented Φ g over the range of factorial values (Fig. 1a). Similarly, at any given
catalyst concentration, an increase in temperature resulted in higher Φ g . At the lowest
X wp values, any rise in catalytic concentration (X pc ) resulted in higher Φ g (Fig. 1b).
On the other hand, due to increment in hydrolysis time (X t ) above 40 min resulted
in lower Φ g owing to the conversion of RS into undesired products (Fig. 1c). From
Fig. 1d, the interaction between X wp and X T indicated that for any given X wp over
factorial range considered in the present study an increase in hydrolysis temperature
resulted in greater Φ g . From Fig. 1e an interesting observation between X T and X t
could be observed for a given hydrolysis time. Any augmentation in IRR temperature