

212
N. Ghosh et al.
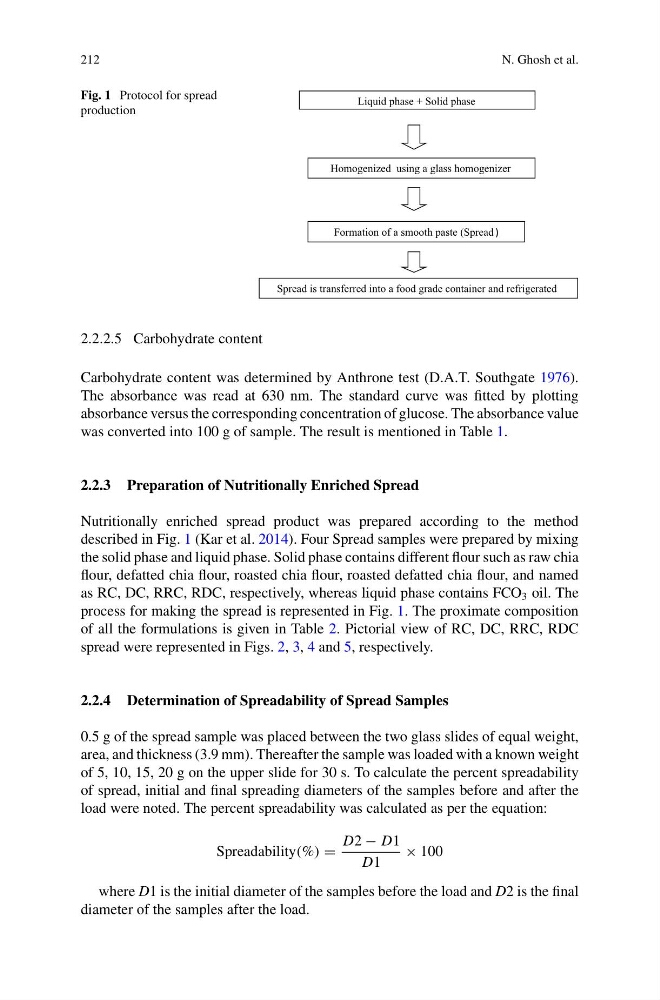
Fig. 1 Protocol for spread
production
Liquid phase + Solid phase
Homogenized using a glass homogenizer
Formation of a smooth paste (Spread )
Spread is transferred into a food grade container and refrigerated
2.2.2.5 Carbohydrate content
Carbohydrate content was determined by Anthrone test (D.A.T. Southgate 1976).
The absorbance was read at 630 nm. The standard curve was fitted by plotting
absorbance versus the corresponding concentration of glucose. The absorbance value
was converted into 100 g of sample. The result is mentioned in Table 1.
2.2.3 Preparation of Nutritionally Enriched Spread
Nutritionally enriched spread product was prepared according to the method
described in Fig. 1 (Kar et al. 2014). Four Spread samples were prepared by mixing
the solid phase and liquid phase. Solid phase contains different flour such as raw chia
flour, defatted chia flour, roasted chia flour, roasted defatted chia flour, and named
as RC, DC, RRC, RDC, respectively, whereas liquid phase contains FCO 3 oil. The
process for making the spread is represented in Fig. 1. The proximate composition
of all the formulations is given in Table 2. Pictorial view of RC, DC, RRC, RDC
spread were represented in Figs. 2, 3, 4 and 5, respectively.
2.2.4 Determination of Spreadability of Spread Samples
0.5 g of the spread sample was placed between the two glass slides of equal weight,
area, and thickness (3.9 mm). Thereafter the sample was loaded with a known weight
of 5, 10, 15, 20 g on the upper slide for 30 s. To calculate the percent spreadability
of spread, initial and final spreading diameters of the samples before and after the
load were noted. The percent spreadability was calculated as per the equation:
Spreadability(%) =
D2 − D1
D1
× 100
where D1 is the initial diameter of the samples before the load and D2 is the final
diameter of the samples after the load.
N. Ghosh et al.
Fig. 1 Protocol for spread
production
Liquid phase + Solid phase
Homogenized using a glass homogenizer
Formation of a smooth paste (Spread )
Spread is transferred into a food grade container and refrigerated
2.2.2.5 Carbohydrate content
Carbohydrate content was determined by Anthrone test (D.A.T. Southgate 1976).
The absorbance was read at 630 nm. The standard curve was fitted by plotting
absorbance versus the corresponding concentration of glucose. The absorbance value
was converted into 100 g of sample. The result is mentioned in Table 1.
2.2.3 Preparation of Nutritionally Enriched Spread
Nutritionally enriched spread product was prepared according to the method
described in Fig. 1 (Kar et al. 2014). Four Spread samples were prepared by mixing
the solid phase and liquid phase. Solid phase contains different flour such as raw chia
flour, defatted chia flour, roasted chia flour, roasted defatted chia flour, and named
as RC, DC, RRC, RDC, respectively, whereas liquid phase contains FCO 3 oil. The
process for making the spread is represented in Fig. 1. The proximate composition
of all the formulations is given in Table 2. Pictorial view of RC, DC, RRC, RDC
spread were represented in Figs. 2, 3, 4 and 5, respectively.
2.2.4 Determination of Spreadability of Spread Samples
0.5 g of the spread sample was placed between the two glass slides of equal weight,
area, and thickness (3.9 mm). Thereafter the sample was loaded with a known weight
of 5, 10, 15, 20 g on the upper slide for 30 s. To calculate the percent spreadability
of spread, initial and final spreading diameters of the samples before and after the
load were noted. The percent spreadability was calculated as per the equation:
Spreadability(%) =
D2 − D1
D1
× 100
where D1 is the initial diameter of the samples before the load and D2 is the final
diameter of the samples after the load.