

154
M. Dev et al.
Inhibition Percentage (I%) = (1 − A/A 0 ) × 100
(A = absorbance of the sample, A 0 = absorbance of the ABTS solution).
2.4 GC-MS Analysis
Two samples were analysed using GC-MS (Thermo Scientific). A fused silica capillary column DB5-MS (30 m × 0.25 mm, film thickness 0.25 μm) was used with
helium as the carrier gas at constant pressure of 100 kPa, at a flow rate of 1 ml/min.
The injector and detector temperature was 250 °C. The components of the essential oil were identified based on a comparison of their retention indexes (RI), mass
spectra (NIST library) and literature data.
2.5 Statistic Analysis
Each analysis was carried out in triplicate. The results were expressed as mean values
and standard deviation. One-way analysis of variance was performed by ANOVA
with post hoc Tukey HSD (honestly significant difference) Test.
3 Results and Discussion
3.1 Antioxidant Activity of Clove Bud Oil and Roasted Vapour
of Clove Bud Using Reducing Power Assay (FRAP)
3.1.1 Reducing Power Assay (FRAP) of Clove Bud Oil and Roasted
Vapour of Clove Bud
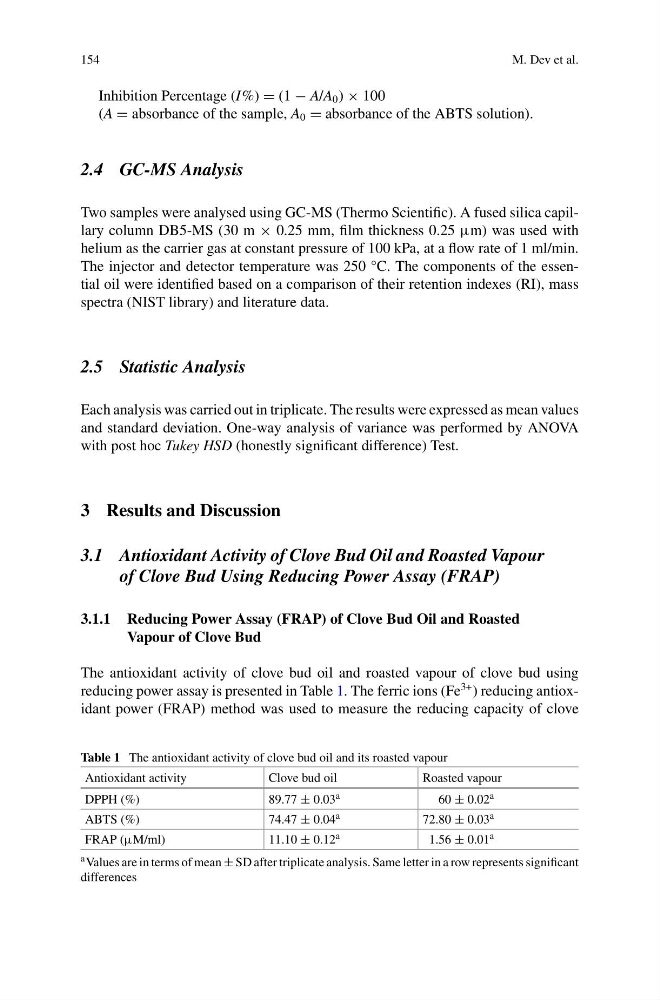
The antioxidant activity of clove bud oil and roasted vapour of clove bud using
reducing power assay is presented in Table 1. The ferric ions (Fe
3+ ) reducing antioxidant power (FRAP) method was used to measure the reducing capacity of clove
Table 1 The antioxidant activity of clove bud oil and its roasted vapour
Antioxidant activity
Clove bud oil
Roasted vapour
DPPH (%)
89.77 ± 0.03 a
60 ± 0.02 a
ABTS (%)
74.47 ± 0.04 a
72.80 ± 0.03 a
FRAP (μM/ml)
11.10 ± 0.12 a
1.56 ± 0.01 a
a Values are in terms of mean ± SD after triplicate analysis. Same letter in a row represents significant
differences
M. Dev et al.
Inhibition Percentage (I%) = (1 − A/A 0 ) × 100
(A = absorbance of the sample, A 0 = absorbance of the ABTS solution).
2.4 GC-MS Analysis
Two samples were analysed using GC-MS (Thermo Scientific). A fused silica capillary column DB5-MS (30 m × 0.25 mm, film thickness 0.25 μm) was used with
helium as the carrier gas at constant pressure of 100 kPa, at a flow rate of 1 ml/min.
The injector and detector temperature was 250 °C. The components of the essential oil were identified based on a comparison of their retention indexes (RI), mass
spectra (NIST library) and literature data.
2.5 Statistic Analysis
Each analysis was carried out in triplicate. The results were expressed as mean values
and standard deviation. One-way analysis of variance was performed by ANOVA
with post hoc Tukey HSD (honestly significant difference) Test.
3 Results and Discussion
3.1 Antioxidant Activity of Clove Bud Oil and Roasted Vapour
of Clove Bud Using Reducing Power Assay (FRAP)
3.1.1 Reducing Power Assay (FRAP) of Clove Bud Oil and Roasted
Vapour of Clove Bud
The antioxidant activity of clove bud oil and roasted vapour of clove bud using
reducing power assay is presented in Table 1. The ferric ions (Fe
3+ ) reducing antioxidant power (FRAP) method was used to measure the reducing capacity of clove
Table 1 The antioxidant activity of clove bud oil and its roasted vapour
Antioxidant activity
Clove bud oil
Roasted vapour
DPPH (%)
89.77 ± 0.03 a
60 ± 0.02 a
ABTS (%)
74.47 ± 0.04 a
72.80 ± 0.03 a
FRAP (μM/ml)
11.10 ± 0.12 a
1.56 ± 0.01 a
a Values are in terms of mean ± SD after triplicate analysis. Same letter in a row represents significant
differences