

Biodegradation of Dyes by Laccase from Isolated …
113
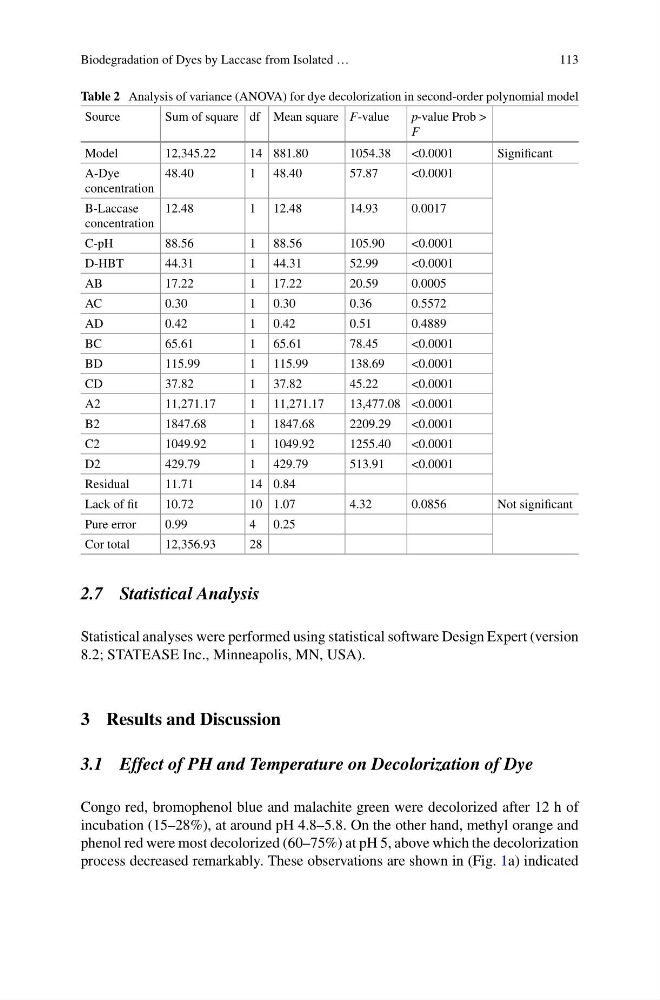
Table 2 Analysis of variance (ANOVA) for dye decolorization in second-order polynomial model
Source
Sum of square df Mean square F-value
p-value Prob >
F
Model
12,345.22
14 881.80
1054.38
<0.0001
Significant
A-Dye
concentration
48.40
1 48.40
57.87
<0.0001
B-Laccase
concentration
12.48
1 12.48
14.93
0.0017
C-pH
88.56
1 88.56
105.90
<0.0001
D-HBT
44.31
1 44.31
52.99
<0.0001
AB
17.22
1 17.22
20.59
0.0005
AC
0.30
1 0.30
0.36
0.5572
AD
0.42
1 0.42
0.51
0.4889
BC
65.61
1 65.61
78.45
<0.0001
BD
115.99
1 115.99
138.69
<0.0001
CD
37.82
1 37.82
45.22
<0.0001
A2
11,271.17
1 11,271.17
13,477.08 <0.0001
B2
1847.68
1 1847.68
2209.29
<0.0001
C2
1049.92
1 1049.92
1255.40
<0.0001
D2
429.79
1 429.79
513.91
<0.0001
Residual
11.71
14 0.84
Lack of fit
10.72
10 1.07
4.32
0.0856
Not significant
Pure error
0.99
4 0.25
Cor total
12,356.93
28
2.7 Statistical Analysis
Statistical analyses were performed using statistical software Design Expert (version
8.2; STATEASE Inc., Minneapolis, MN, USA).
3 Results and Discussion
3.1 Effect of PH and Temperature on Decolorization of Dye
Congo red, bromophenol blue and malachite green were decolorized after 12 h of
incubation (15–28%), at around pH 4.8–5.8. On the other hand, methyl orange and
phenol red were most decolorized (60–75%) at pH 5, above which the decolorization
process decreased remarkably. These observations are shown in (Fig. 1a) indicated
113
Table 2 Analysis of variance (ANOVA) for dye decolorization in second-order polynomial model
Source
Sum of square df Mean square F-value
p-value Prob >
F
Model
12,345.22
14 881.80
1054.38
<0.0001
Significant
A-Dye
concentration
48.40
1 48.40
57.87
<0.0001
B-Laccase
concentration
12.48
1 12.48
14.93
0.0017
C-pH
88.56
1 88.56
105.90
<0.0001
D-HBT
44.31
1 44.31
52.99
<0.0001
AB
17.22
1 17.22
20.59
0.0005
AC
0.30
1 0.30
0.36
0.5572
AD
0.42
1 0.42
0.51
0.4889
BC
65.61
1 65.61
78.45
<0.0001
BD
115.99
1 115.99
138.69
<0.0001
CD
37.82
1 37.82
45.22
<0.0001
A2
11,271.17
1 11,271.17
13,477.08 <0.0001
B2
1847.68
1 1847.68
2209.29
<0.0001
C2
1049.92
1 1049.92
1255.40
<0.0001
D2
429.79
1 429.79
513.91
<0.0001
Residual
11.71
14 0.84
Lack of fit
10.72
10 1.07
4.32
0.0856
Not significant
Pure error
0.99
4 0.25
Cor total
12,356.93
28
2.7 Statistical Analysis
Statistical analyses were performed using statistical software Design Expert (version
8.2; STATEASE Inc., Minneapolis, MN, USA).
3 Results and Discussion
3.1 Effect of PH and Temperature on Decolorization of Dye
Congo red, bromophenol blue and malachite green were decolorized after 12 h of
incubation (15–28%), at around pH 4.8–5.8. On the other hand, methyl orange and
phenol red were most decolorized (60–75%) at pH 5, above which the decolorization
process decreased remarkably. These observations are shown in (Fig. 1a) indicated