

The Effect of Titanium Carbide and Spark Plasma Sintering …
71
0
100
200
300
400
500
600
C
i
T
5
2
-
i
N
C
i
0
1
-
i
N
C
i
T
5
-
i
N
Microhardness
(HV)
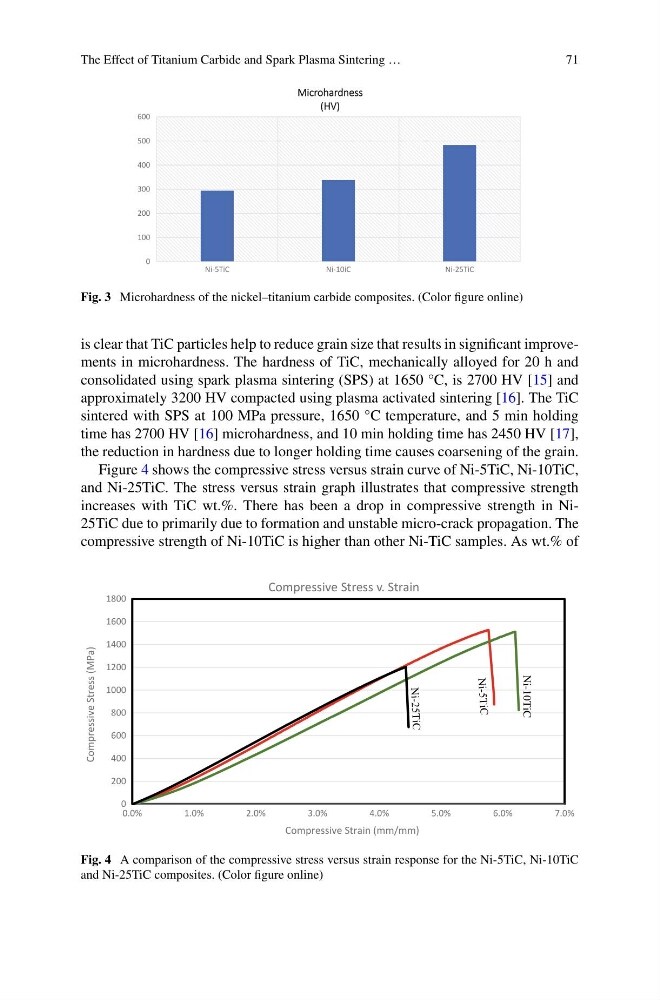
Fig. 3 Microhardness of the nickel–titanium carbide composites. (Color figure online)
is clear that TiC particles help to reduce grain size that results in significant improvements in microhardness. The hardness of TiC, mechanically alloyed for 20 h and
consolidated using spark plasma sintering (SPS) at 1650 °C, is 2700 HV [15] and
approximately 3200 HV compacted using plasma activated sintering [16]. The TiC
sintered with SPS at 100 MPa pressure, 1650 °C temperature, and 5 min holding
time has 2700 HV [16] microhardness, and 10 min holding time has 2450 HV [17],
the reduction in hardness due to longer holding time causes coarsening of the grain.
Figure 4 shows the compressive stress versus strain curve of Ni-5TiC, Ni-10TiC,
and Ni-25TiC. The stress versus strain graph illustrates that compressive strength
increases with TiC wt.%. There has been a drop in compressive strength in Ni25TiC due to primarily due to formation and unstable micro-crack propagation. The
compressive strength of Ni-10TiC is higher than other Ni-TiC samples. As wt.% of
0
200
400
600
800
1000
1200
1400
1600
1800
0.0%
1.0%
2.0%
3.0%
4.0%
5.0%
6.0%
7.0%
Compressive Stress (MPa)
Compressive Strain (mm/mm)
Compressive Stress v. Strain
Ni-10TiC
Fig. 4 A comparison of the compressive stress versus strain response for the Ni-5TiC, Ni-10TiC
and Ni-25TiC composites. (Color figure online)
71
0
100
200
300
400
500
600
C
i
T
5
2
-
i
N
C
i
0
1
-
i
N
C
i
T
5
-
i
N
Microhardness
(HV)
Fig. 3 Microhardness of the nickel–titanium carbide composites. (Color figure online)
is clear that TiC particles help to reduce grain size that results in significant improvements in microhardness. The hardness of TiC, mechanically alloyed for 20 h and
consolidated using spark plasma sintering (SPS) at 1650 °C, is 2700 HV [15] and
approximately 3200 HV compacted using plasma activated sintering [16]. The TiC
sintered with SPS at 100 MPa pressure, 1650 °C temperature, and 5 min holding
time has 2700 HV [16] microhardness, and 10 min holding time has 2450 HV [17],
the reduction in hardness due to longer holding time causes coarsening of the grain.
Figure 4 shows the compressive stress versus strain curve of Ni-5TiC, Ni-10TiC,
and Ni-25TiC. The stress versus strain graph illustrates that compressive strength
increases with TiC wt.%. There has been a drop in compressive strength in Ni25TiC due to primarily due to formation and unstable micro-crack propagation. The
compressive strength of Ni-10TiC is higher than other Ni-TiC samples. As wt.% of
0
200
400
600
800
1000
1200
1400
1600
1800
0.0%
1.0%
2.0%
3.0%
4.0%
5.0%
6.0%
7.0%
Compressive Stress (MPa)
Compressive Strain (mm/mm)
Compressive Stress v. Strain
Ni-10TiC
Fig. 4 A comparison of the compressive stress versus strain response for the Ni-5TiC, Ni-10TiC
and Ni-25TiC composites. (Color figure online)