

Understanding the Mechanical Response of Friction Stir Welded …
55
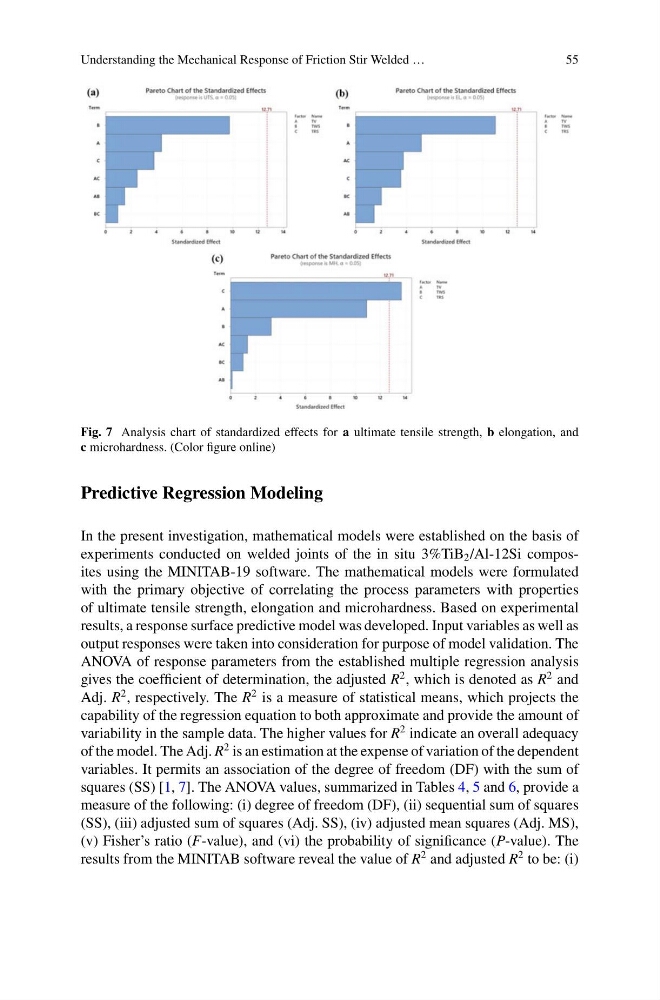
Fig. 7 Analysis chart of standardized effects for a ultimate tensile strength, b elongation, and
c microhardness. (Color figure online)
Predictive Regression Modeling
In the present investigation, mathematical models were established on the basis of
experiments conducted on welded joints of the in situ 3%TiB 2 /Al-12Si composites using the MINITAB-19 software. The mathematical models were formulated
with the primary objective of correlating the process parameters with properties
of ultimate tensile strength, elongation and microhardness. Based on experimental
results, a response surface predictive model was developed. Input variables as well as
output responses were taken into consideration for purpose of model validation. The
ANOVA of response parameters from the established multiple regression analysis
gives the coefficient of determination, the adjusted R
2 , which is denoted as R
2 and
Adj. R
2 , respectively. The R
2 is a measure of statistical means, which projects the
capability of the regression equation to both approximate and provide the amount of
variability in the sample data. The higher values for R
2 indicate an overall adequacy
of the model. The Adj. R
2 is an estimation at the expense of variation of the dependent
variables. It permits an association of the degree of freedom (DF) with the sum of
squares (SS) [1, 7]. The ANOVA values, summarized in Tables 4, 5 and 6, provide a
measure of the following: (i) degree of freedom (DF), (ii) sequential sum of squares
(SS), (iii) adjusted sum of squares (Adj. SS), (iv) adjusted mean squares (Adj. MS),
(v) Fisher’s ratio (F-value), and (vi) the probability of significance (P-value). The
results from the MINITAB software reveal the value of R
2 and adjusted R
2 to be: (i)
55
Fig. 7 Analysis chart of standardized effects for a ultimate tensile strength, b elongation, and
c microhardness. (Color figure online)
Predictive Regression Modeling
In the present investigation, mathematical models were established on the basis of
experiments conducted on welded joints of the in situ 3%TiB 2 /Al-12Si composites using the MINITAB-19 software. The mathematical models were formulated
with the primary objective of correlating the process parameters with properties
of ultimate tensile strength, elongation and microhardness. Based on experimental
results, a response surface predictive model was developed. Input variables as well as
output responses were taken into consideration for purpose of model validation. The
ANOVA of response parameters from the established multiple regression analysis
gives the coefficient of determination, the adjusted R
2 , which is denoted as R
2 and
Adj. R
2 , respectively. The R
2 is a measure of statistical means, which projects the
capability of the regression equation to both approximate and provide the amount of
variability in the sample data. The higher values for R
2 indicate an overall adequacy
of the model. The Adj. R
2 is an estimation at the expense of variation of the dependent
variables. It permits an association of the degree of freedom (DF) with the sum of
squares (SS) [1, 7]. The ANOVA values, summarized in Tables 4, 5 and 6, provide a
measure of the following: (i) degree of freedom (DF), (ii) sequential sum of squares
(SS), (iii) adjusted sum of squares (Adj. SS), (iv) adjusted mean squares (Adj. MS),
(v) Fisher’s ratio (F-value), and (vi) the probability of significance (P-value). The
results from the MINITAB software reveal the value of R
2 and adjusted R
2 to be: (i)