

248
H. T. Sessions Jr. and S. E. H. Murph
the signal contribution of protium. As expected, when molecular deuterium was
the selected carrier gas in a sample mixture containing both protium and molecular
deuterium, hydrogen signal would be easily detectable. In the same time, the contribution of molecular deuterium would be masked and leave only the hydrogen signal.
What was unknown was how this gas chromatograph configuration would respond
to the presence of protium-deuterium (HD) in the sample mix.
The gas chromatograph was configured with two molecular sieve columns. One
column was supplied with molecular hydrogen carrier gas and the other column
was supplied with molecular deuterium carrier. Both columns were equipped with
thermal conductivity detectors.
Initially gas mixtures containing (25% protium, 75% molecular deuterium),
(50% protium, 50% molecular deuterium), and (75% protium, 25% molecular
deuterium) were produced and analyzed. As anticipated each gas chromatograph
column displayed only one peak and this peak area amplitude varied as predicted.
The maximum height of the peak for the gas chromatograph column with protium
carrier gas was with the (25% protium, 75% molecular deuterium) mixture and the
minimum peak height was produced by (75% protium, 25% molecular deuterium)
mixture. This result support our hypothesis and the peak were attributed to the
molecular deuterium concentration. The maximum height of the peak for the gas
chromatograph column with molecular deuterium carrier gas was produced by the
(75% protium, 25% molecular deuterium) mixture and the minimum peak height was
with the (25% protium, 75% molecular deuterium) mixture. Each gas sample was
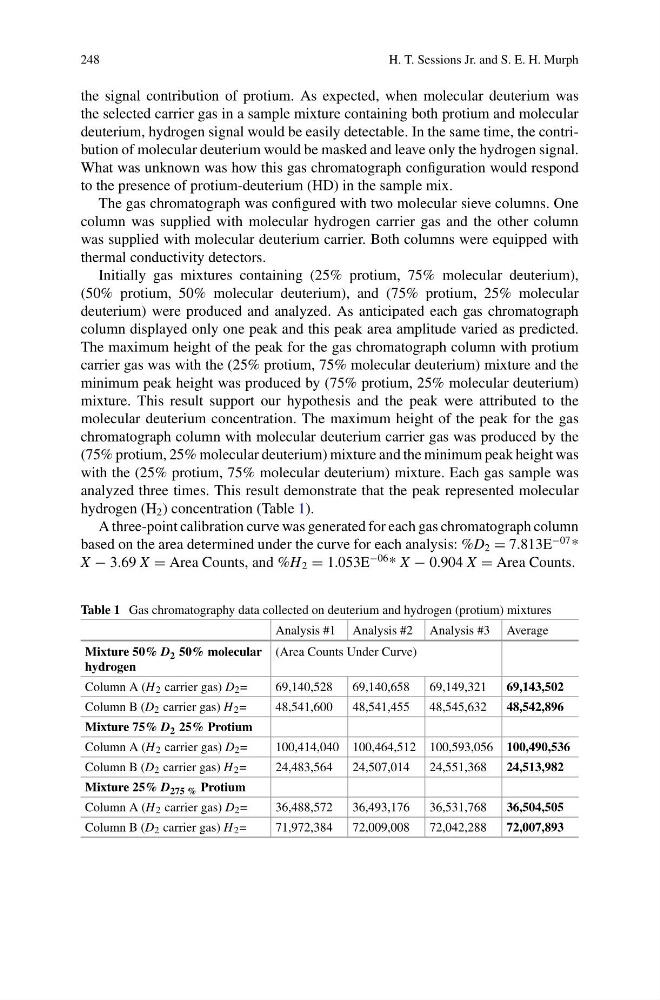
analyzed three times. This result demonstrate that the peak represented molecular
hydrogen (H 2 ) concentration (Table 1).
A three-point calibration curve was generated for each gas chromatograph column
based on the area determined under the curve for each analysis: %D 2 = 7.813E
−07 *
X − 3.69 X = Area Counts, and %H 2 = 1.053E
−06 * X − 0.904 X = Area Counts.
Table 1 Gas chromatography data collected on deuterium and hydrogen (protium) mixtures
Analysis #1 Analysis #2 Analysis #3 Average
Mixture 50% D 2 50% molecular
hydrogen
(Area Counts Under Curve)
Column A (H 2 carrier gas) D 2 =
69,140,528
69,140,658
69,149,321
69,143,502
Column B (D 2 carrier gas) H 2 =
48,541,600
48,541,455
48,545,632
48,542,896
Mixture 75% D 2 25% Protium
Column A (H 2 carrier gas) D 2 =
100,414,040 100,464,512 100,593,056 100,490,536
Column B (D 2 carrier gas) H 2 =
24,483,564
24,507,014
24,551,368
24,513,982
Mixture 25% D 275 % Protium
Column A (H 2 carrier gas) D 2 =
36,488,572
36,493,176
36,531,768
36,504,505
Column B (D 2 carrier gas) H 2 =
71,972,384
72,009,008
72,042,288
72,007,893
H. T. Sessions Jr. and S. E. H. Murph
the signal contribution of protium. As expected, when molecular deuterium was
the selected carrier gas in a sample mixture containing both protium and molecular
deuterium, hydrogen signal would be easily detectable. In the same time, the contribution of molecular deuterium would be masked and leave only the hydrogen signal.
What was unknown was how this gas chromatograph configuration would respond
to the presence of protium-deuterium (HD) in the sample mix.
The gas chromatograph was configured with two molecular sieve columns. One
column was supplied with molecular hydrogen carrier gas and the other column
was supplied with molecular deuterium carrier. Both columns were equipped with
thermal conductivity detectors.
Initially gas mixtures containing (25% protium, 75% molecular deuterium),
(50% protium, 50% molecular deuterium), and (75% protium, 25% molecular
deuterium) were produced and analyzed. As anticipated each gas chromatograph
column displayed only one peak and this peak area amplitude varied as predicted.
The maximum height of the peak for the gas chromatograph column with protium
carrier gas was with the (25% protium, 75% molecular deuterium) mixture and the
minimum peak height was produced by (75% protium, 25% molecular deuterium)
mixture. This result support our hypothesis and the peak were attributed to the
molecular deuterium concentration. The maximum height of the peak for the gas
chromatograph column with molecular deuterium carrier gas was produced by the
(75% protium, 25% molecular deuterium) mixture and the minimum peak height was
with the (25% protium, 75% molecular deuterium) mixture. Each gas sample was
analyzed three times. This result demonstrate that the peak represented molecular
hydrogen (H 2 ) concentration (Table 1).
A three-point calibration curve was generated for each gas chromatograph column
based on the area determined under the curve for each analysis: %D 2 = 7.813E
−07 *
X − 3.69 X = Area Counts, and %H 2 = 1.053E
−06 * X − 0.904 X = Area Counts.
Table 1 Gas chromatography data collected on deuterium and hydrogen (protium) mixtures
Analysis #1 Analysis #2 Analysis #3 Average
Mixture 50% D 2 50% molecular
hydrogen
(Area Counts Under Curve)
Column A (H 2 carrier gas) D 2 =
69,140,528
69,140,658
69,149,321
69,143,502
Column B (D 2 carrier gas) H 2 =
48,541,600
48,541,455
48,545,632
48,542,896
Mixture 75% D 2 25% Protium
Column A (H 2 carrier gas) D 2 =
100,414,040 100,464,512 100,593,056 100,490,536
Column B (D 2 carrier gas) H 2 =
24,483,564
24,507,014
24,551,368
24,513,982
Mixture 25% D 275 % Protium
Column A (H 2 carrier gas) D 2 =
36,488,572
36,493,176
36,531,768
36,504,505
Column B (D 2 carrier gas) H 2 =
71,972,384
72,009,008
72,042,288
72,007,893