

236
A. Gupta and C. Srivastava
and
c =
N o π kD
A
(14)
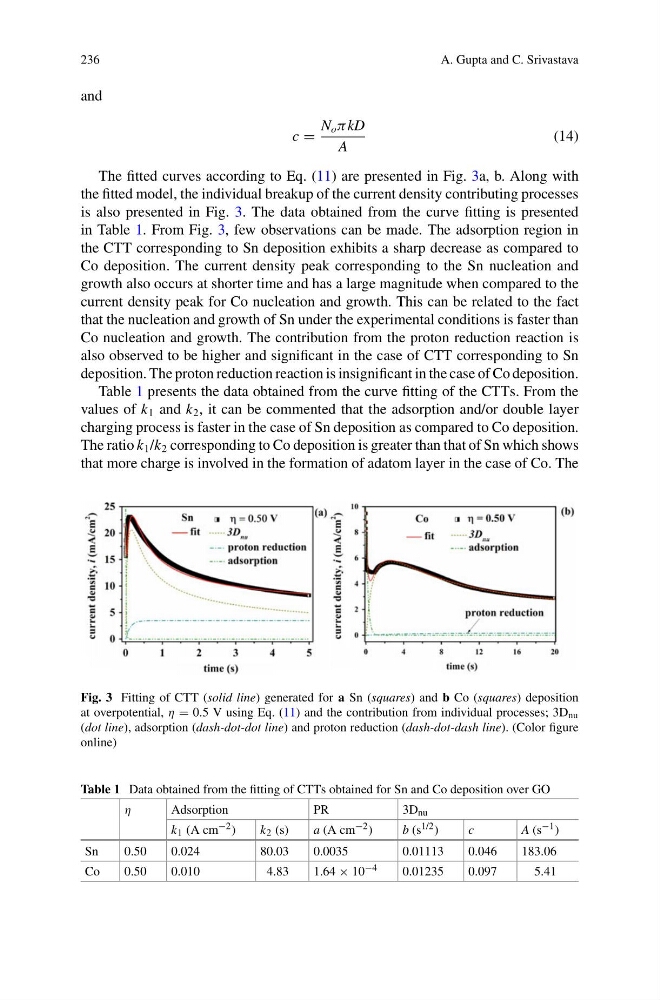
The fitted curves according to Eq. (11) are presented in Fig. 3a, b. Along with
the fitted model, the individual breakup of the current density contributing processes
is also presented in Fig. 3. The data obtained from the curve fitting is presented
in Table 1. From Fig. 3, few observations can be made. The adsorption region in
the CTT corresponding to Sn deposition exhibits a sharp decrease as compared to
Co deposition. The current density peak corresponding to the Sn nucleation and
growth also occurs at shorter time and has a large magnitude when compared to the
current density peak for Co nucleation and growth. This can be related to the fact
that the nucleation and growth of Sn under the experimental conditions is faster than
Co nucleation and growth. The contribution from the proton reduction reaction is
also observed to be higher and significant in the case of CTT corresponding to Sn
deposition. The proton reduction reaction is insignificant in the case of Co deposition.
Table 1 presents the data obtained from the curve fitting of the CTTs. From the
values of k 1 and k 2 , it can be commented that the adsorption and/or double layer
charging process is faster in the case of Sn deposition as compared to Co deposition.
The ratio k 1 /k 2 corresponding to Co deposition is greater than that of Sn which shows
that more charge is involved in the formation of adatom layer in the case of Co. The
Fig. 3 Fitting of CTT (solid line) generated for a Sn (squares) and b Co (squares) deposition
at overpotential, η = 0.5 V using Eq. (11) and the contribution from individual processes; 3D nu
(dot line), adsorption (dash-dot-dot line) and proton reduction (dash-dot-dash line). (Color figure
online)
Table 1 Data obtained from the fitting of CTTs obtained for Sn and Co deposition over GO
η
Adsorption
PR
3D nu
k 1 (A cm −2 )
k 2 (s)
a (A cm −2 )
b (s 1/2 )
c
A (s −1 )
Sn
0.50
0.024
80.03
0.0035
0.01113
0.046
183.06
Co
0.50
0.010
4.83
1.64 × 10 −4
0.01235
0.097
5.41
A. Gupta and C. Srivastava
and
c =
N o π kD
A
(14)
The fitted curves according to Eq. (11) are presented in Fig. 3a, b. Along with
the fitted model, the individual breakup of the current density contributing processes
is also presented in Fig. 3. The data obtained from the curve fitting is presented
in Table 1. From Fig. 3, few observations can be made. The adsorption region in
the CTT corresponding to Sn deposition exhibits a sharp decrease as compared to
Co deposition. The current density peak corresponding to the Sn nucleation and
growth also occurs at shorter time and has a large magnitude when compared to the
current density peak for Co nucleation and growth. This can be related to the fact
that the nucleation and growth of Sn under the experimental conditions is faster than
Co nucleation and growth. The contribution from the proton reduction reaction is
also observed to be higher and significant in the case of CTT corresponding to Sn
deposition. The proton reduction reaction is insignificant in the case of Co deposition.
Table 1 presents the data obtained from the curve fitting of the CTTs. From the
values of k 1 and k 2 , it can be commented that the adsorption and/or double layer
charging process is faster in the case of Sn deposition as compared to Co deposition.
The ratio k 1 /k 2 corresponding to Co deposition is greater than that of Sn which shows
that more charge is involved in the formation of adatom layer in the case of Co. The
Fig. 3 Fitting of CTT (solid line) generated for a Sn (squares) and b Co (squares) deposition
at overpotential, η = 0.5 V using Eq. (11) and the contribution from individual processes; 3D nu
(dot line), adsorption (dash-dot-dot line) and proton reduction (dash-dot-dash line). (Color figure
online)
Table 1 Data obtained from the fitting of CTTs obtained for Sn and Co deposition over GO
η
Adsorption
PR
3D nu
k 1 (A cm −2 )
k 2 (s)
a (A cm −2 )
b (s 1/2 )
c
A (s −1 )
Sn
0.50
0.024
80.03
0.0035
0.01113
0.046
183.06
Co
0.50
0.010
4.83
1.64 × 10 −4
0.01235
0.097
5.41