

192
K. A. S. Fessler et al.
trum (blue) displaying noise from etaloning and the filtered spectrum (red) showing
no etaloning effects. The reduction of noise in the spectrum improves the ability
to discern small shifts in the absorbance band. Blank spectra are collected when
the sample cell is under vacuum, just before sample is introduced, and are Fourier
processed in the same way as uranium hexafluoride sample spectra. Blank subtracted
spectra are mean centered and normalized between 1155 and 1162 cm
−1 to correct
for minor pressure variations in sample loading.
For uranium hexafluoride enrichment, the concentration of interest is the isotopic
content of uranium-235 and uranium-238. The infrared absorption band of the ν 1 +
ν 3 uranium-235 band around 1291 cm
−1 is shifted by about 0.65 cm
−1 from that of
uranium-238 [14, 15]. The ν 2 + ν 3 uranium hexafluoride absorption band at approximately 1157 cm
−1 displays a similar uranium isotope shift to the ν 1 + ν 3 band. The
infrared shift of the 1157 cm
−1 absorbance band of uranium hexafluoride as a function
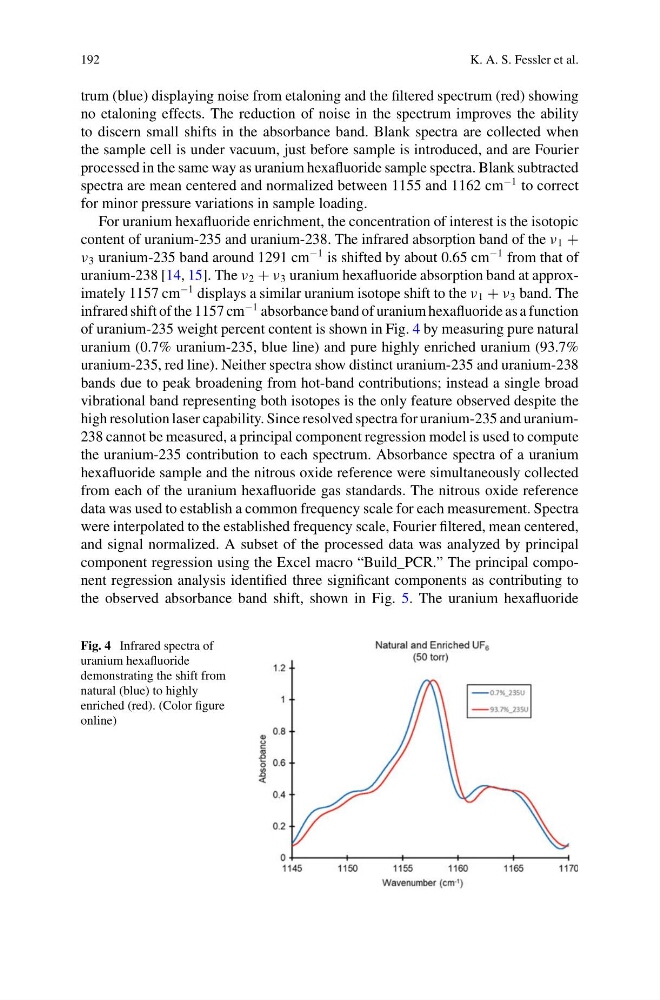
of uranium-235 weight percent content is shown in Fig. 4 by measuring pure natural
uranium (0.7% uranium-235, blue line) and pure highly enriched uranium (93.7%
uranium-235, red line). Neither spectra show distinct uranium-235 and uranium-238
bands due to peak broadening from hot-band contributions; instead a single broad
vibrational band representing both isotopes is the only feature observed despite the
high resolution laser capability. Since resolved spectra for uranium-235 and uranium238 cannot be measured, a principal component regression model is used to compute
the uranium-235 contribution to each spectrum. Absorbance spectra of a uranium
hexafluoride sample and the nitrous oxide reference were simultaneously collected
from each of the uranium hexafluoride gas standards. The nitrous oxide reference
data was used to establish a common frequency scale for each measurement. Spectra
were interpolated to the established frequency scale, Fourier filtered, mean centered,
and signal normalized. A subset of the processed data was analyzed by principal
component regression using the Excel macro “Build_PCR.” The principal component regression analysis identified three significant components as contributing to
the observed absorbance band shift, shown in Fig. 5. The uranium hexafluoride
Fig. 4 Infrared spectra of
uranium hexafluoride
demonstrating the shift from
natural (blue) to highly
enriched (red). (Color figure
online)
K. A. S. Fessler et al.
trum (blue) displaying noise from etaloning and the filtered spectrum (red) showing
no etaloning effects. The reduction of noise in the spectrum improves the ability
to discern small shifts in the absorbance band. Blank spectra are collected when
the sample cell is under vacuum, just before sample is introduced, and are Fourier
processed in the same way as uranium hexafluoride sample spectra. Blank subtracted
spectra are mean centered and normalized between 1155 and 1162 cm
−1 to correct
for minor pressure variations in sample loading.
For uranium hexafluoride enrichment, the concentration of interest is the isotopic
content of uranium-235 and uranium-238. The infrared absorption band of the ν 1 +
ν 3 uranium-235 band around 1291 cm
−1 is shifted by about 0.65 cm
−1 from that of
uranium-238 [14, 15]. The ν 2 + ν 3 uranium hexafluoride absorption band at approximately 1157 cm
−1 displays a similar uranium isotope shift to the ν 1 + ν 3 band. The
infrared shift of the 1157 cm
−1 absorbance band of uranium hexafluoride as a function
of uranium-235 weight percent content is shown in Fig. 4 by measuring pure natural
uranium (0.7% uranium-235, blue line) and pure highly enriched uranium (93.7%
uranium-235, red line). Neither spectra show distinct uranium-235 and uranium-238
bands due to peak broadening from hot-band contributions; instead a single broad
vibrational band representing both isotopes is the only feature observed despite the
high resolution laser capability. Since resolved spectra for uranium-235 and uranium238 cannot be measured, a principal component regression model is used to compute
the uranium-235 contribution to each spectrum. Absorbance spectra of a uranium
hexafluoride sample and the nitrous oxide reference were simultaneously collected
from each of the uranium hexafluoride gas standards. The nitrous oxide reference
data was used to establish a common frequency scale for each measurement. Spectra
were interpolated to the established frequency scale, Fourier filtered, mean centered,
and signal normalized. A subset of the processed data was analyzed by principal
component regression using the Excel macro “Build_PCR.” The principal component regression analysis identified three significant components as contributing to
the observed absorbance band shift, shown in Fig. 5. The uranium hexafluoride
Fig. 4 Infrared spectra of
uranium hexafluoride
demonstrating the shift from
natural (blue) to highly
enriched (red). (Color figure
online)