

Correlation of Fine Scale Microstructure and Mechanical …
141
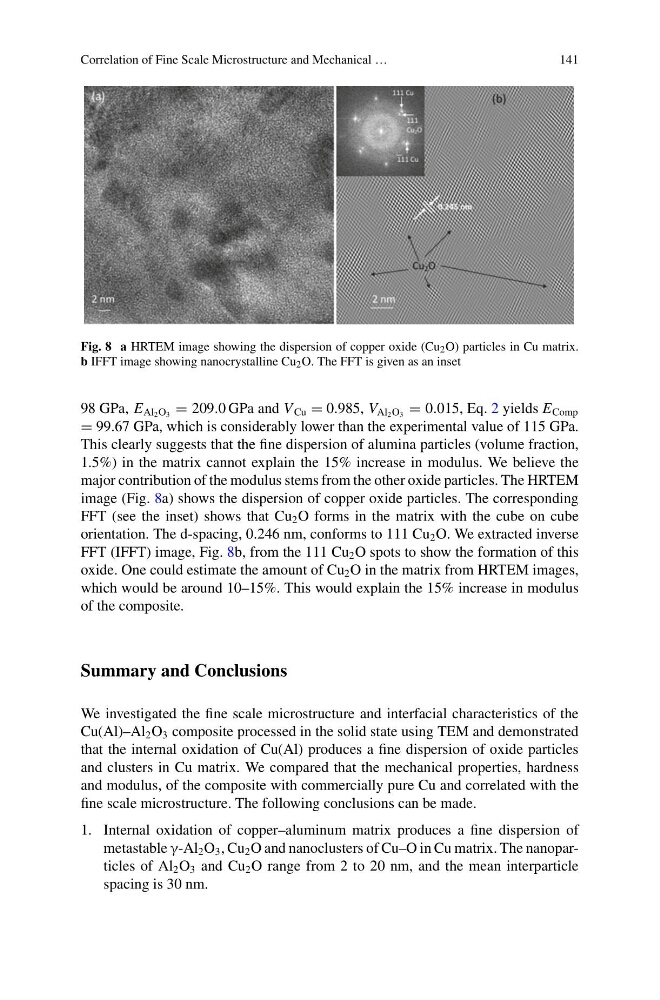
Fig. 8 a HRTEM image showing the dispersion of copper oxide (Cu 2 O) particles in Cu matrix.
b IFFT image showing nanocrystalline Cu 2 O. The FFT is given as an inset
98 GPa, E Al 2 O 3 = 209.0 GPa and V Cu = 0.985, V Al 2 O 3 = 0.015, Eq. 2 yields E Comp
= 99.67 GPa, which is considerably lower than the experimental value of 115 GPa.
This clearly suggests that the fine dispersion of alumina particles (volume fraction,
1.5%) in the matrix cannot explain the 15% increase in modulus. We believe the
major contribution of the modulus stems from the other oxide particles. The HRTEM
image (Fig. 8a) shows the dispersion of copper oxide particles. The corresponding
FFT (see the inset) shows that Cu 2 O forms in the matrix with the cube on cube
orientation. The d-spacing, 0.246 nm, conforms to 111 Cu 2 O. We extracted inverse
FFT (IFFT) image, Fig. 8b, from the 111 Cu 2 O spots to show the formation of this
oxide. One could estimate the amount of Cu 2 O in the matrix from HRTEM images,
which would be around 10–15%. This would explain the 15% increase in modulus
of the composite.
Summary and Conclusions
We investigated the fine scale microstructure and interfacial characteristics of the
Cu(Al)–Al 2 O 3 composite processed in the solid state using TEM and demonstrated
that the internal oxidation of Cu(Al) produces a fine dispersion of oxide particles
and clusters in Cu matrix. We compared that the mechanical properties, hardness
and modulus, of the composite with commercially pure Cu and correlated with the
fine scale microstructure. The following conclusions can be made.
1. Internal oxidation of copper–aluminum matrix produces a fine dispersion of
metastable γ-Al 2 O 3 , Cu 2 O and nanoclusters of Cu–O in Cu matrix. The nanoparticles of Al 2 O 3 and Cu 2 O range from 2 to 20 nm, and the mean interparticle
spacing is 30 nm.
141
Fig. 8 a HRTEM image showing the dispersion of copper oxide (Cu 2 O) particles in Cu matrix.
b IFFT image showing nanocrystalline Cu 2 O. The FFT is given as an inset
98 GPa, E Al 2 O 3 = 209.0 GPa and V Cu = 0.985, V Al 2 O 3 = 0.015, Eq. 2 yields E Comp
= 99.67 GPa, which is considerably lower than the experimental value of 115 GPa.
This clearly suggests that the fine dispersion of alumina particles (volume fraction,
1.5%) in the matrix cannot explain the 15% increase in modulus. We believe the
major contribution of the modulus stems from the other oxide particles. The HRTEM
image (Fig. 8a) shows the dispersion of copper oxide particles. The corresponding
FFT (see the inset) shows that Cu 2 O forms in the matrix with the cube on cube
orientation. The d-spacing, 0.246 nm, conforms to 111 Cu 2 O. We extracted inverse
FFT (IFFT) image, Fig. 8b, from the 111 Cu 2 O spots to show the formation of this
oxide. One could estimate the amount of Cu 2 O in the matrix from HRTEM images,
which would be around 10–15%. This would explain the 15% increase in modulus
of the composite.
Summary and Conclusions
We investigated the fine scale microstructure and interfacial characteristics of the
Cu(Al)–Al 2 O 3 composite processed in the solid state using TEM and demonstrated
that the internal oxidation of Cu(Al) produces a fine dispersion of oxide particles
and clusters in Cu matrix. We compared that the mechanical properties, hardness
and modulus, of the composite with commercially pure Cu and correlated with the
fine scale microstructure. The following conclusions can be made.
1. Internal oxidation of copper–aluminum matrix produces a fine dispersion of
metastable γ-Al 2 O 3 , Cu 2 O and nanoclusters of Cu–O in Cu matrix. The nanoparticles of Al 2 O 3 and Cu 2 O range from 2 to 20 nm, and the mean interparticle
spacing is 30 nm.