

6.3 Effective Nucleon–Nucleon Interactions for Gamow Shell Model. . .
259
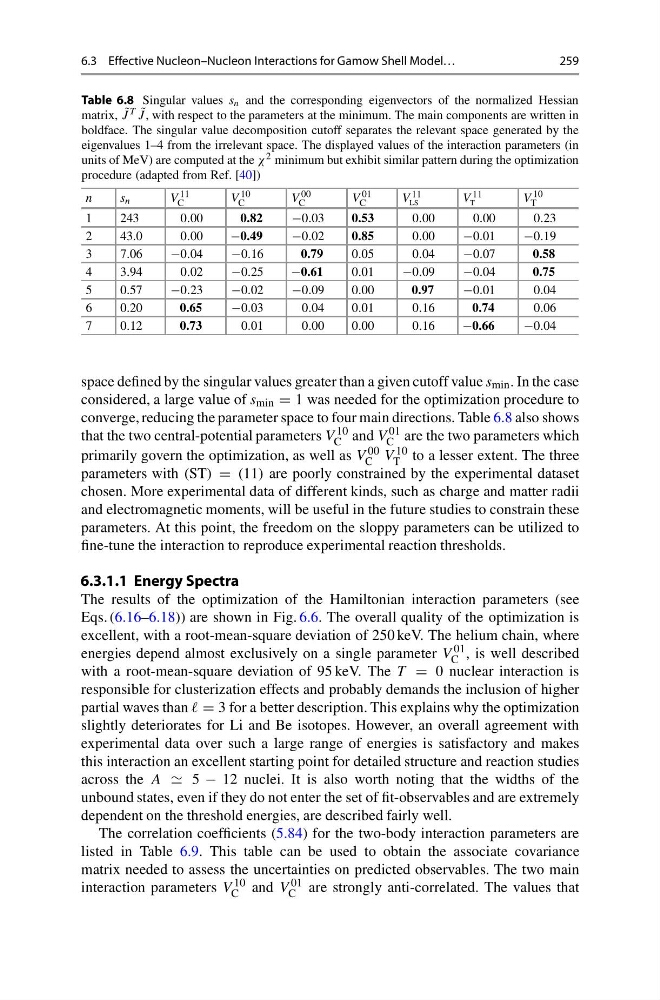
Table 6.8 Singular values s n and the corresponding eigenvectors of the normalized Hessian
matrix, ˜
J T ˜
J , with respect to the parameters at the minimum. The main components are written in
boldface. The singular value decomposition cutoff separates the relevant space generated by the
eigenvalues 1–4 from the irrelevant space. The displayed values of the interaction parameters (in
units of MeV) are computed at the χ 2 minimum but exhibit similar pattern during the optimization
procedure (adapted from Ref. [40])
n
s n
V 11
C
V 10
C
V 00
C
V 01
C
V 11
LS
V 11
T
V 10
T
1
243
0.00
0.82
−0.03
0.53
0.00
0.00
0.23
2
43.0
0.00
−0.49
−0.02
0.85
0.00
−0.01
−0.19
3
7.06
−0.04
−0.16
0.79
0.05
0.04
−0.07
0.58
4
3.94
0.02
−0.25
−0.61
0.01
−0.09
−0.04
0.75
5
0.57
−0.23
−0.02
−0.09
0.00
0.97
−0.01
0.04
6
0.20
0.65
−0.03
0.04
0.01
0.16
0.74
0.06
7
0.12
0.73
0.01
0.00
0.00
0.16
−0.66
−0.04
space defined by the singular values greater than a given cutoff value s min . In the case
considered, a large value of s min = 1 was needed for the optimization procedure to
converge, reducing the parameter space to four main directions. Table 6.8 also shows
that the two central-potential parameters V 10
C and V 01
C are the two parameters which
primarily govern the optimization, as well as V 00
C V 10
T to a lesser extent. The three
parameters with (ST) = (11) are poorly constrained by the experimental dataset
chosen. More experimental data of different kinds, such as charge and matter radii
and electromagnetic moments, will be useful in the future studies to constrain these
parameters. At this point, the freedom on the sloppy parameters can be utilized to
fine-tune the interaction to reproduce experimental reaction thresholds.
6.3.1.1 Energy Spectra
The results of the optimization of the Hamiltonian interaction parameters (see
Eqs. (6.16–6.18)) are shown in Fig. 6.6. The overall quality of the optimization is
excellent, with a root-mean-square deviation of 250 keV. The helium chain, where
energies depend almost exclusively on a single parameter V 01
C , is well described
with a root-mean-square deviation of 95 keV. The T = 0 nuclear interaction is
responsible for clusterization effects and probably demands the inclusion of higher
partial waves than = 3 for a better description. This explains why the optimization
slightly deteriorates for Li and Be isotopes. However, an overall agreement with
experimental data over such a large range of energies is satisfactory and makes
this interaction an excellent starting point for detailed structure and reaction studies
across the A 5 − 12 nuclei. It is also worth noting that the widths of the
unbound states, even if they do not enter the set of fit-observables and are extremely
dependent on the threshold energies, are described fairly well.
The correlation coefficients (5.84) for the two-body interaction parameters are
listed in Table 6.9. This table can be used to obtain the associate covariance
matrix needed to assess the uncertainties on predicted observables. The two main
interaction parameters V 10
C and V 01
C are strongly anti-correlated. The values that
259
Table 6.8 Singular values s n and the corresponding eigenvectors of the normalized Hessian
matrix, ˜
J T ˜
J , with respect to the parameters at the minimum. The main components are written in
boldface. The singular value decomposition cutoff separates the relevant space generated by the
eigenvalues 1–4 from the irrelevant space. The displayed values of the interaction parameters (in
units of MeV) are computed at the χ 2 minimum but exhibit similar pattern during the optimization
procedure (adapted from Ref. [40])
n
s n
V 11
C
V 10
C
V 00
C
V 01
C
V 11
LS
V 11
T
V 10
T
1
243
0.00
0.82
−0.03
0.53
0.00
0.00
0.23
2
43.0
0.00
−0.49
−0.02
0.85
0.00
−0.01
−0.19
3
7.06
−0.04
−0.16
0.79
0.05
0.04
−0.07
0.58
4
3.94
0.02
−0.25
−0.61
0.01
−0.09
−0.04
0.75
5
0.57
−0.23
−0.02
−0.09
0.00
0.97
−0.01
0.04
6
0.20
0.65
−0.03
0.04
0.01
0.16
0.74
0.06
7
0.12
0.73
0.01
0.00
0.00
0.16
−0.66
−0.04
space defined by the singular values greater than a given cutoff value s min . In the case
considered, a large value of s min = 1 was needed for the optimization procedure to
converge, reducing the parameter space to four main directions. Table 6.8 also shows
that the two central-potential parameters V 10
C and V 01
C are the two parameters which
primarily govern the optimization, as well as V 00
C V 10
T to a lesser extent. The three
parameters with (ST) = (11) are poorly constrained by the experimental dataset
chosen. More experimental data of different kinds, such as charge and matter radii
and electromagnetic moments, will be useful in the future studies to constrain these
parameters. At this point, the freedom on the sloppy parameters can be utilized to
fine-tune the interaction to reproduce experimental reaction thresholds.
6.3.1.1 Energy Spectra
The results of the optimization of the Hamiltonian interaction parameters (see
Eqs. (6.16–6.18)) are shown in Fig. 6.6. The overall quality of the optimization is
excellent, with a root-mean-square deviation of 250 keV. The helium chain, where
energies depend almost exclusively on a single parameter V 01
C , is well described
with a root-mean-square deviation of 95 keV. The T = 0 nuclear interaction is
responsible for clusterization effects and probably demands the inclusion of higher
partial waves than = 3 for a better description. This explains why the optimization
slightly deteriorates for Li and Be isotopes. However, an overall agreement with
experimental data over such a large range of energies is satisfactory and makes
this interaction an excellent starting point for detailed structure and reaction studies
across the A 5 − 12 nuclei. It is also worth noting that the widths of the
unbound states, even if they do not enter the set of fit-observables and are extremely
dependent on the threshold energies, are described fairly well.
The correlation coefficients (5.84) for the two-body interaction parameters are
listed in Table 6.9. This table can be used to obtain the associate covariance
matrix needed to assess the uncertainties on predicted observables. The two main
interaction parameters V 10
C and V 01
C are strongly anti-correlated. The values that