

4.3 The Particle-Rotor Model in the Berggren Basis
169
0.0
0.2
0.4
0.6
0.8
1.0
J(J + 1)
0.0
0.2
0.4
0.6
0.8
1.0
-1.0
-0.5
0.0
0.5
1.0
Energy
(10
−3
Ry)
max = 2
max = 4, 6
Q -
zz = -2.42 ea 2
0
threshold
(a)
0 2
6
12
20
-1.0
-0.5
0.0
Energy
(10
−2
Ry)
max = 4
max = 6
max = 8
max = 10, 12
Q +
zz = +6.88 ea 2
0
threshold
(b)
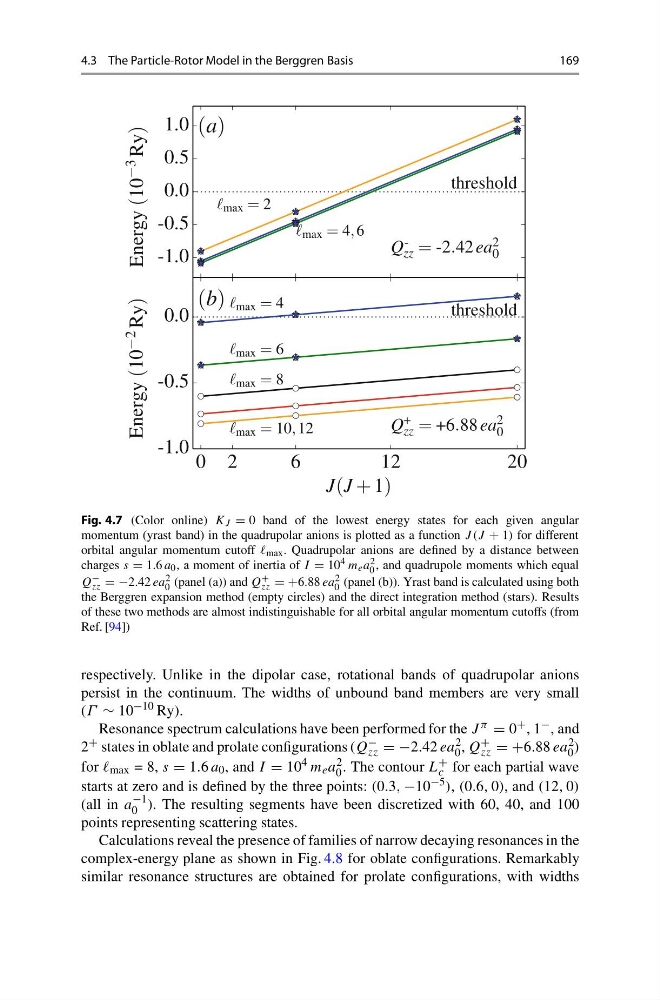
Fig. 4.7 (Color online) K J = 0 band of the lowest energy states for each given angular
momentum (yrast band) in the quadrupolar anions is plotted as a function J (J + 1) for different
orbital angular momentum cutoff max . Quadrupolar anions are defined by a distance between
charges s = 1.6 a 0 , a moment of inertia of I = 10
4 m e a 2
0 , and quadrupole moments which equal
Q −
zz = −2.42 ea 2
0 (panel (a)) and Q +
zz = +6.88 ea 2
0 (panel (b)). Yrast band is calculated using both
the Berggren expansion method (empty circles) and the direct integration method (stars). Results
of these two methods are almost indistinguishable for all orbital angular momentum cutoffs (from
Ref. [94])
respectively. Unlike in the dipolar case, rotational bands of quadrupolar anions
persist in the continuum. The widths of unbound band members are very small
(Γ ∼ 10
−10 Ry).
Resonance spectrum calculations have been performed for the J π = 0 + , 1 − , and
2 + states in oblate and prolate configurations (Q −
zz = −2.42 ea 2
0 , Q +
zz = +6.88 ea 2
0 )
for max = 8, s = 1.6 a 0 , and I = 10
4 m e a 2
0 . The contour L +
c for each partial wave
starts at zero and is defined by the three points: (0.3, −10 −5 ), (0.6, 0), and (12, 0)
(all in a
−1
0 ). The resulting segments have been discretized with 60, 40, and 100
points representing scattering states.
Calculations reveal the presence of families of narrow decaying resonances in the
complex-energy plane as shown in Fig. 4.8 for oblate configurations. Remarkably
similar resonance structures are obtained for prolate configurations, with widths
169
0.0
0.2
0.4
0.6
0.8
1.0
J(J + 1)
0.0
0.2
0.4
0.6
0.8
1.0
-1.0
-0.5
0.0
0.5
1.0
Energy
(10
−3
Ry)
max = 2
max = 4, 6
Q -
zz = -2.42 ea 2
0
threshold
(a)
0 2
6
12
20
-1.0
-0.5
0.0
Energy
(10
−2
Ry)
max = 4
max = 6
max = 8
max = 10, 12
Q +
zz = +6.88 ea 2
0
threshold
(b)
Fig. 4.7 (Color online) K J = 0 band of the lowest energy states for each given angular
momentum (yrast band) in the quadrupolar anions is plotted as a function J (J + 1) for different
orbital angular momentum cutoff max . Quadrupolar anions are defined by a distance between
charges s = 1.6 a 0 , a moment of inertia of I = 10
4 m e a 2
0 , and quadrupole moments which equal
Q −
zz = −2.42 ea 2
0 (panel (a)) and Q +
zz = +6.88 ea 2
0 (panel (b)). Yrast band is calculated using both
the Berggren expansion method (empty circles) and the direct integration method (stars). Results
of these two methods are almost indistinguishable for all orbital angular momentum cutoffs (from
Ref. [94])
respectively. Unlike in the dipolar case, rotational bands of quadrupolar anions
persist in the continuum. The widths of unbound band members are very small
(Γ ∼ 10
−10 Ry).
Resonance spectrum calculations have been performed for the J π = 0 + , 1 − , and
2 + states in oblate and prolate configurations (Q −
zz = −2.42 ea 2
0 , Q +
zz = +6.88 ea 2
0 )
for max = 8, s = 1.6 a 0 , and I = 10
4 m e a 2
0 . The contour L +
c for each partial wave
starts at zero and is defined by the three points: (0.3, −10 −5 ), (0.6, 0), and (12, 0)
(all in a
−1
0 ). The resulting segments have been discretized with 60, 40, and 100
points representing scattering states.
Calculations reveal the presence of families of narrow decaying resonances in the
complex-energy plane as shown in Fig. 4.8 for oblate configurations. Remarkably
similar resonance structures are obtained for prolate configurations, with widths