

4.3 The Particle-Rotor Model in the Berggren Basis
165
0
1
2
10
15
20
25
30
0
5
HCN
-
threshold
0
1
2
3
mix
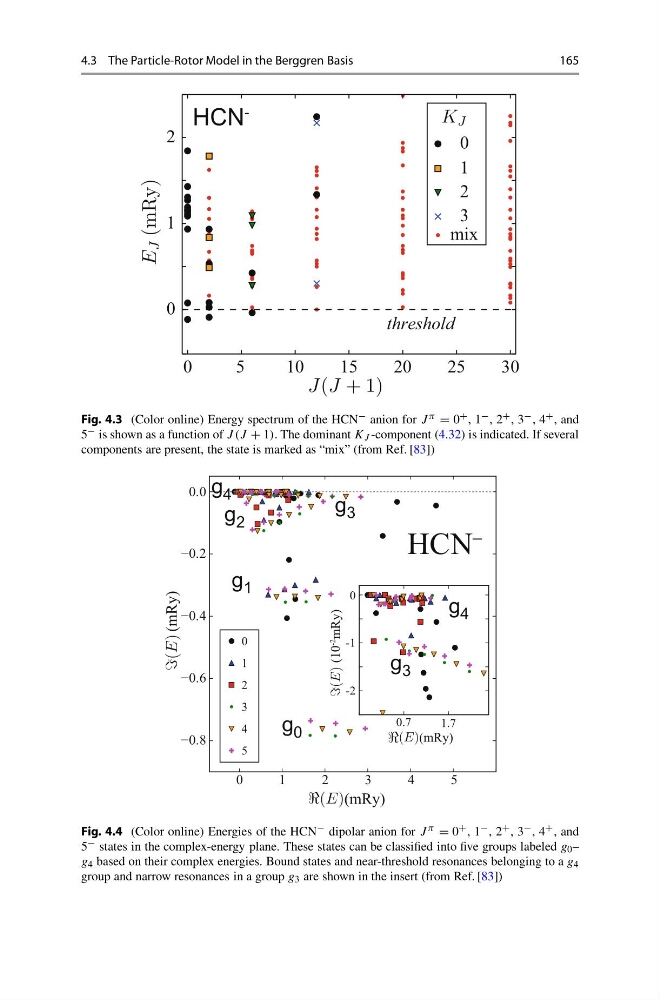
Fig. 4.3 (Color online) Energy spectrum of the HCN − anion for J π = 0 + , 1 − , 2 + , 3 − , 4 + , and
5 − is shown as a function of J (J + 1). The dominant K J -component (4.32) is indicated. If several
components are present, the state is marked as “mix” (from Ref. [83])
0
1
2
3
4
5
−0.8
−0.6
−0.4
−0.2
0.0
0.7
1.7
-2
-1
0
(mRy)
(mRy)
0
1
2
3
4
5
(mRy)
(10
-2
mRy)
HCN
−
g 0
g 1
g 2
g 4
g 3
g 3
g 4
Fig. 4.4 (Color online) Energies of the HCN − dipolar anion for J π = 0 + , 1 − , 2 + , 3 − , 4 + , and
5 − states in the complex-energy plane. These states can be classified into five groups labeled g 0 –
g 4 based on their complex energies. Bound states and near-threshold resonances belonging to a g 4
group and narrow resonances in a group g 3 are shown in the insert (from Ref. [83])
165
0
1
2
10
15
20
25
30
0
5
HCN
-
threshold
0
1
2
3
mix
Fig. 4.3 (Color online) Energy spectrum of the HCN − anion for J π = 0 + , 1 − , 2 + , 3 − , 4 + , and
5 − is shown as a function of J (J + 1). The dominant K J -component (4.32) is indicated. If several
components are present, the state is marked as “mix” (from Ref. [83])
0
1
2
3
4
5
−0.8
−0.6
−0.4
−0.2
0.0
0.7
1.7
-2
-1
0
(mRy)
(mRy)
0
1
2
3
4
5
(mRy)
(10
-2
mRy)
HCN
−
g 0
g 1
g 2
g 4
g 3
g 3
g 4
Fig. 4.4 (Color online) Energies of the HCN − dipolar anion for J π = 0 + , 1 − , 2 + , 3 − , 4 + , and
5 − states in the complex-energy plane. These states can be classified into five groups labeled g 0 –
g 4 based on their complex energies. Bound states and near-threshold resonances belonging to a g 4
group and narrow resonances in a group g 3 are shown in the insert (from Ref. [83])