

by ethanol consumption down to a concentration of 15 g L
À1 . However, after 22 h of
process time, no further biomass growth could be observed.
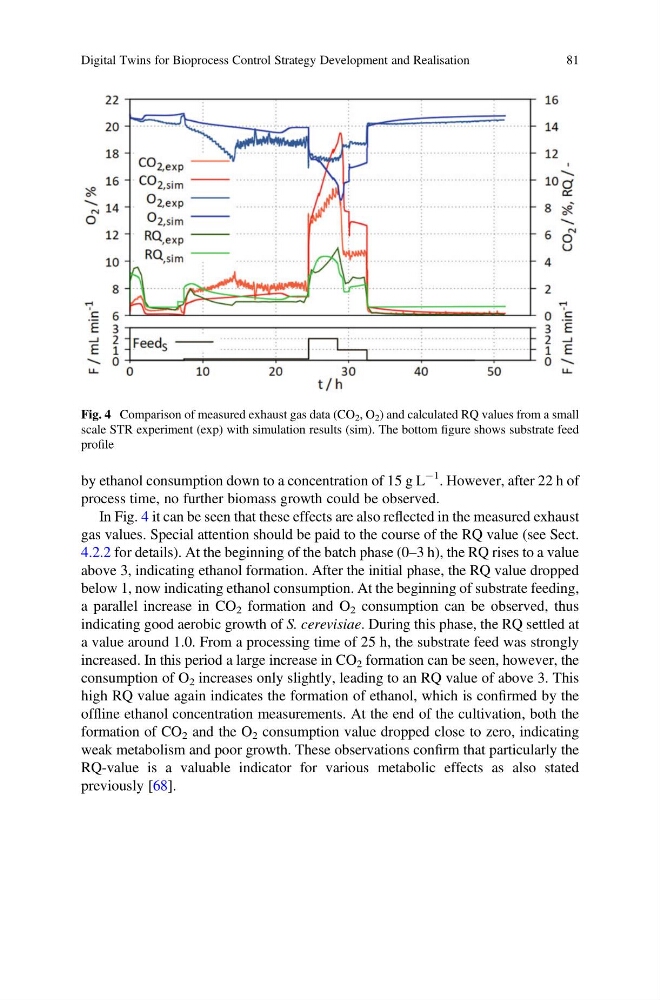
In Fig. 4 it can be seen that these effects are also reflected in the measured exhaust
gas values. Special attention should be paid to the course of the RQ value (see Sect.
4.2.2 for details). At the beginning of the batch phase (0–3 h), the RQ rises to a value
above 3, indicating ethanol formation. After the initial phase, the RQ value dropped
below 1, now indicating ethanol consumption. At the beginning of substrate feeding,
a parallel increase in CO 2 formation and O 2 consumption can be observed, thus
indicating good aerobic growth of S. cerevisiae. During this phase, the RQ settled at
a value around 1.0. From a processing time of 25 h, the substrate feed was strongly
increased. In this period a large increase in CO 2 formation can be seen, however, the
consumption of O 2 increases only slightly, leading to an RQ value of above 3. This
high RQ value again indicates the formation of ethanol, which is confirmed by the
offline ethanol concentration measurements. At the end of the cultivation, both the
formation of CO 2 and the O 2 consumption value dropped close to zero, indicating
weak metabolism and poor growth. These observations confirm that particularly the
RQ-value is a valuable indicator for various metabolic effects as also stated
previously [68].
Fig. 4 Comparison of measured exhaust gas data (CO 2 , O 2 ) and calculated RQ values from a small
scale STR experiment (exp) with simulation results (sim). The bottom figure shows substrate feed
profile
Digital Twins for Bioprocess Control Strategy Development and Realisation
81
À1 . However, after 22 h of
process time, no further biomass growth could be observed.
In Fig. 4 it can be seen that these effects are also reflected in the measured exhaust
gas values. Special attention should be paid to the course of the RQ value (see Sect.
4.2.2 for details). At the beginning of the batch phase (0–3 h), the RQ rises to a value
above 3, indicating ethanol formation. After the initial phase, the RQ value dropped
below 1, now indicating ethanol consumption. At the beginning of substrate feeding,
a parallel increase in CO 2 formation and O 2 consumption can be observed, thus
indicating good aerobic growth of S. cerevisiae. During this phase, the RQ settled at
a value around 1.0. From a processing time of 25 h, the substrate feed was strongly
increased. In this period a large increase in CO 2 formation can be seen, however, the
consumption of O 2 increases only slightly, leading to an RQ value of above 3. This
high RQ value again indicates the formation of ethanol, which is confirmed by the
offline ethanol concentration measurements. At the end of the cultivation, both the
formation of CO 2 and the O 2 consumption value dropped close to zero, indicating
weak metabolism and poor growth. These observations confirm that particularly the
RQ-value is a valuable indicator for various metabolic effects as also stated
previously [68].
Fig. 4 Comparison of measured exhaust gas data (CO 2 , O 2 ) and calculated RQ values from a small
scale STR experiment (exp) with simulation results (sim). The bottom figure shows substrate feed
profile
Digital Twins for Bioprocess Control Strategy Development and Realisation
81