

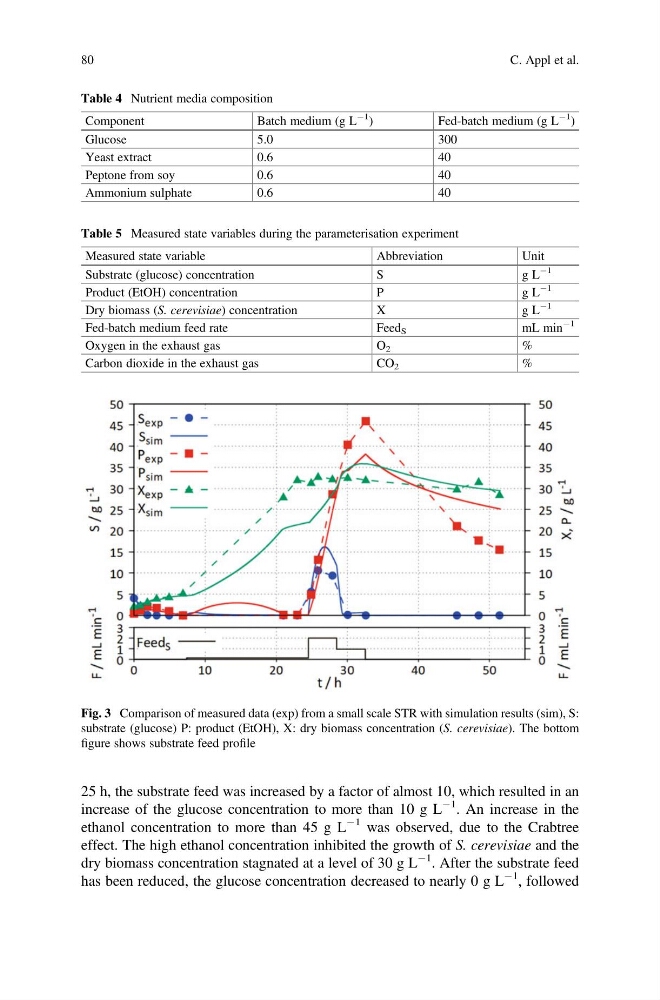
25 h, the substrate feed was increased by a factor of almost 10, which resulted in an
increase of the glucose concentration to more than 10 g L
À1
. An increase in the
ethanol concentration to more than 45 g L
À1 was observed, due to the Crabtree
effect. The high ethanol concentration inhibited the growth of S. cerevisiae and the
dry biomass concentration stagnated at a level of 30 g L
À1 . After the substrate feed
has been reduced, the glucose concentration decreased to nearly 0 g L
À1 , followed
Table 4 Nutrient media composition
Component
Batch medium (g L
À1
)
Fed-batch medium (g L
À1
)
Glucose
5.0
300
Yeast extract
0.6
40
Peptone from soy
0.6
40
Ammonium sulphate
0.6
40
Table 5 Measured state variables during the parameterisation experiment
Measured state variable
Abbreviation
Unit
Substrate (glucose) concentration
S
g L
À1
Product (EtOH) concentration
P
g L
À1
Dry biomass (S. cerevisiae) concentration
X
g L
À1
Fed-batch medium feed rate
Feed S
mL min
À1
Oxygen in the exhaust gas
O 2
%
Carbon dioxide in the exhaust gas
CO 2
%
Fig. 3 Comparison of measured data (exp) from a small scale STR with simulation results (sim), S:
substrate (glucose) P: product (EtOH), X: dry biomass concentration (S. cerevisiae). The bottom
figure shows substrate feed profile
80
C. Appl et al.
increase of the glucose concentration to more than 10 g L
À1
. An increase in the
ethanol concentration to more than 45 g L
À1 was observed, due to the Crabtree
effect. The high ethanol concentration inhibited the growth of S. cerevisiae and the
dry biomass concentration stagnated at a level of 30 g L
À1 . After the substrate feed
has been reduced, the glucose concentration decreased to nearly 0 g L
À1 , followed
Table 4 Nutrient media composition
Component
Batch medium (g L
À1
)
Fed-batch medium (g L
À1
)
Glucose
5.0
300
Yeast extract
0.6
40
Peptone from soy
0.6
40
Ammonium sulphate
0.6
40
Table 5 Measured state variables during the parameterisation experiment
Measured state variable
Abbreviation
Unit
Substrate (glucose) concentration
S
g L
À1
Product (EtOH) concentration
P
g L
À1
Dry biomass (S. cerevisiae) concentration
X
g L
À1
Fed-batch medium feed rate
Feed S
mL min
À1
Oxygen in the exhaust gas
O 2
%
Carbon dioxide in the exhaust gas
CO 2
%
Fig. 3 Comparison of measured data (exp) from a small scale STR with simulation results (sim), S:
substrate (glucose) P: product (EtOH), X: dry biomass concentration (S. cerevisiae). The bottom
figure shows substrate feed profile
80
C. Appl et al.