

By considering q Glc , it becomes clear that the lowest values were obtained for
impeller speeds in the range of N s1u N N s1 in both cases. This is due to the
efficient metabolization of glucose under these hydrodynamic conditions. The
calculated values for the hMSCs correspond to those determined by Rafiq et al.
[54] and Heathmann et al. [107] in different cell culture media. The highest q Glc
(21–35 pmol/cell/d) were found at the highest impeller speeds. The relationship
between the q Glc and the specific power input can be expressed by a statistical,
logarithmic function of 3rd order. Similar correlations were also found for q Lac and
q Amn . However, such statistical correlations are only valid for the investigated P/V
range. Values of up to 193% and 170% higher than those in the spinner flasks at N s1u
and N s1 were determined for q Lac and q Amn at the highest impeller speeds. These
higher values indicated that the cells are more stressed at higher impeller speeds as a
result of the higher hydrodynamic stresses. The different correlations obtained were
used as initial parameters for the cell growth modelling (see Sect. 4.2).
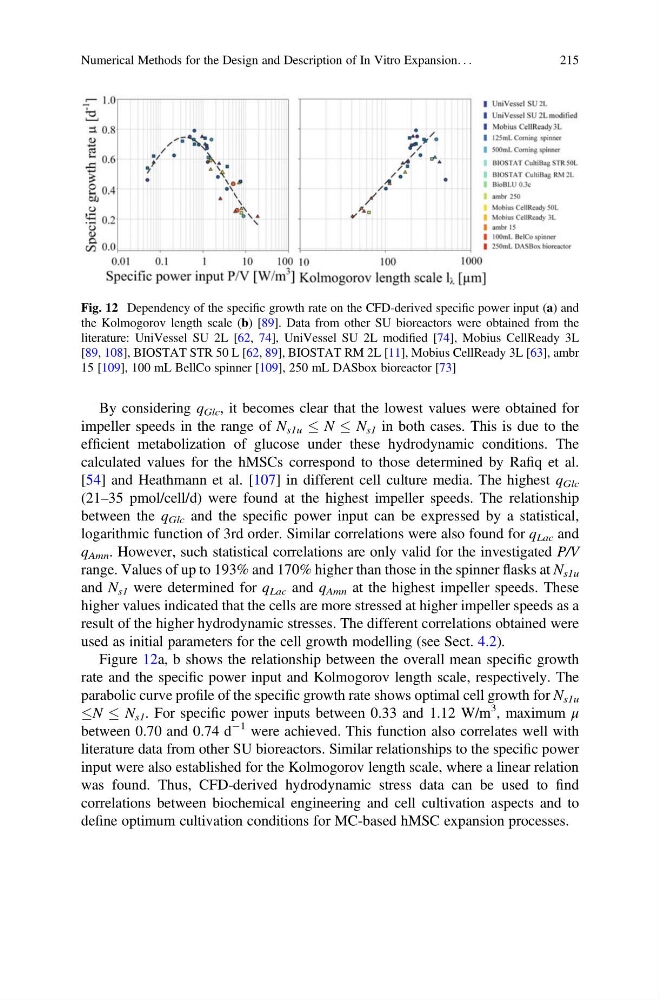
Figure 12a, b shows the relationship between the overall mean specific growth
rate and the specific power input and Kolmogorov length scale, respectively. The
parabolic curve profile of the specific growth rate shows optimal cell growth for N s1u
N
N s1 . For specific power inputs between 0.33 and 1.12 W/m
3 , maximum μ
between 0.70 and 0.74 d
À1 were achieved. This function also correlates well with
literature data from other SU bioreactors. Similar relationships to the specific power
input were also established for the Kolmogorov length scale, where a linear relation
was found. Thus, CFD-derived hydrodynamic stress data can be used to find
correlations between biochemical engineering and cell cultivation aspects and to
define optimum cultivation conditions for MC-based hMSC expansion processes.
Fig. 12 Dependency of the specific growth rate on the CFD-derived specific power input (a) and
the Kolmogorov length scale (b) [89]. Data from other SU bioreactors were obtained from the
literature: UniVessel SU 2L [62, 74], UniVessel SU 2L modified [74], Mobius CellReady 3L
[89, 108], BIOSTAT STR 50 L [62, 89], BIOSTAT RM 2L [11], Mobius CellReady 3L [63], ambr
15 [109], 100 mL BellCo spinner [109], 250 mL DASbox bioreactor [73]
Numerical Methods for the Design and Description of In Vitro Expansion. . .
215
impeller speeds in the range of N s1u N N s1 in both cases. This is due to the
efficient metabolization of glucose under these hydrodynamic conditions. The
calculated values for the hMSCs correspond to those determined by Rafiq et al.
[54] and Heathmann et al. [107] in different cell culture media. The highest q Glc
(21–35 pmol/cell/d) were found at the highest impeller speeds. The relationship
between the q Glc and the specific power input can be expressed by a statistical,
logarithmic function of 3rd order. Similar correlations were also found for q Lac and
q Amn . However, such statistical correlations are only valid for the investigated P/V
range. Values of up to 193% and 170% higher than those in the spinner flasks at N s1u
and N s1 were determined for q Lac and q Amn at the highest impeller speeds. These
higher values indicated that the cells are more stressed at higher impeller speeds as a
result of the higher hydrodynamic stresses. The different correlations obtained were
used as initial parameters for the cell growth modelling (see Sect. 4.2).
Figure 12a, b shows the relationship between the overall mean specific growth
rate and the specific power input and Kolmogorov length scale, respectively. The
parabolic curve profile of the specific growth rate shows optimal cell growth for N s1u
N
N s1 . For specific power inputs between 0.33 and 1.12 W/m
3 , maximum μ
between 0.70 and 0.74 d
À1 were achieved. This function also correlates well with
literature data from other SU bioreactors. Similar relationships to the specific power
input were also established for the Kolmogorov length scale, where a linear relation
was found. Thus, CFD-derived hydrodynamic stress data can be used to find
correlations between biochemical engineering and cell cultivation aspects and to
define optimum cultivation conditions for MC-based hMSC expansion processes.
Fig. 12 Dependency of the specific growth rate on the CFD-derived specific power input (a) and
the Kolmogorov length scale (b) [89]. Data from other SU bioreactors were obtained from the
literature: UniVessel SU 2L [62, 74], UniVessel SU 2L modified [74], Mobius CellReady 3L
[89, 108], BIOSTAT STR 50 L [62, 89], BIOSTAT RM 2L [11], Mobius CellReady 3L [63], ambr
15 [109], 100 mL BellCo spinner [109], 250 mL DASbox bioreactor [73]
Numerical Methods for the Design and Description of In Vitro Expansion. . .
215