

k L ¼ 2 ∙
ffiffiffiffiffiffiffiffiffi
D O2
π ∙ t c
r
ð3Þ
Since the fluid flow in the SP100 was mainly tangentially oriented, the contact
time was calculated based on the sum of the fluid velocities (w/o the axial component
v
!
) and the mean perimeter of the vessel (see Eq. (4)).
t c ¼
π ∙ d R
ffiffiffiffiffiffiffiffiffiffiffiffiffiffiffiffi ffi
u
! 2 þ w
! 2
q
ð4Þ
The specific interface area (a) was defined according to Zhang et al. [94] as the
area with a liquid volume fraction of α L ¼ 0.5 divided by the total liquid volume (see
Eq. (5)).
a ¼
A α L ¼0:5
V L
ð5Þ
Using this model approach, k L a values of between 2.6 and 4.2 h
À1 were predicted
for impeller speeds between 49 and 120 rpm (¼ u tip 0.10–0.26 m/s). Compared to
experimentally measured k L a values (2.6–4.3 h
À1 ), which were measured in a SP100
specially equipped with an optical pO 2 sensor, only minor differences were found.
Consequently, the multi-phase CFD model provided reliable predictions about the
oxygen mass transfer in the spinner flasks, especially due to the moderate fluid flow
conditions and the surface aeration.
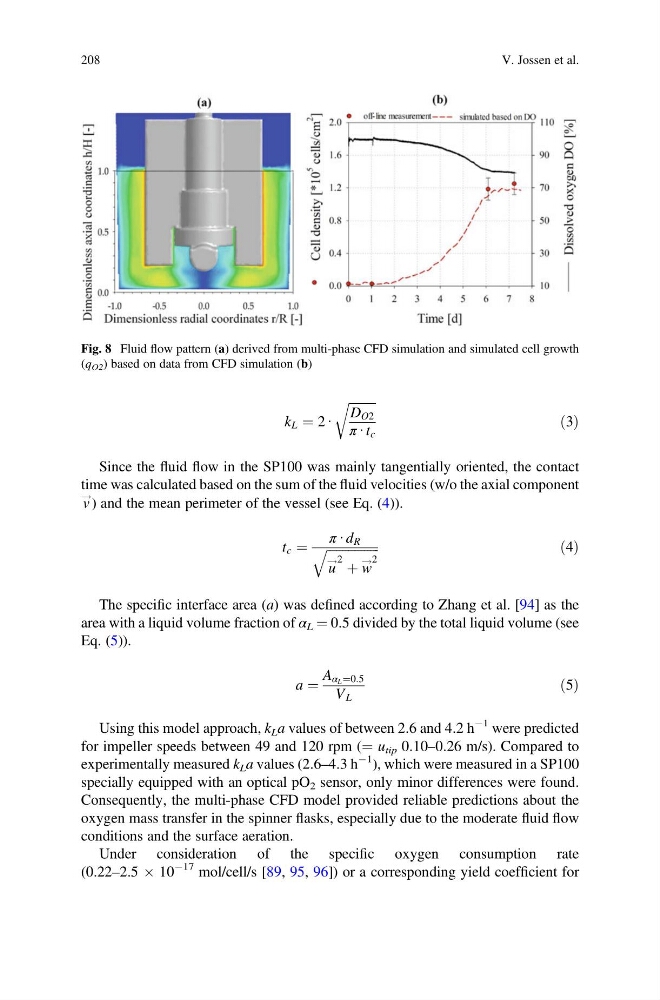
Under consideration of the specific oxygen consumption rate
(0.22–2.5 Â 10
À17 mol/cell/s [89, 95, 96]) or a corresponding yield coefficient for
Fig. 8 Fluid flow pattern (a) derived from multi-phase CFD simulation and simulated cell growth
(q O2 ) based on data from CFD simulation (b)
208
V. Jossen et al.
ffiffiffiffiffiffiffiffiffi
D O2
π ∙ t c
r
ð3Þ
Since the fluid flow in the SP100 was mainly tangentially oriented, the contact
time was calculated based on the sum of the fluid velocities (w/o the axial component
v
!
) and the mean perimeter of the vessel (see Eq. (4)).
t c ¼
π ∙ d R
ffiffiffiffiffiffiffiffiffiffiffiffiffiffiffiffi ffi
u
! 2 þ w
! 2
q
ð4Þ
The specific interface area (a) was defined according to Zhang et al. [94] as the
area with a liquid volume fraction of α L ¼ 0.5 divided by the total liquid volume (see
Eq. (5)).
a ¼
A α L ¼0:5
V L
ð5Þ
Using this model approach, k L a values of between 2.6 and 4.2 h
À1 were predicted
for impeller speeds between 49 and 120 rpm (¼ u tip 0.10–0.26 m/s). Compared to
experimentally measured k L a values (2.6–4.3 h
À1 ), which were measured in a SP100
specially equipped with an optical pO 2 sensor, only minor differences were found.
Consequently, the multi-phase CFD model provided reliable predictions about the
oxygen mass transfer in the spinner flasks, especially due to the moderate fluid flow
conditions and the surface aeration.
Under consideration of the specific oxygen consumption rate
(0.22–2.5 Â 10
À17 mol/cell/s [89, 95, 96]) or a corresponding yield coefficient for
Fig. 8 Fluid flow pattern (a) derived from multi-phase CFD simulation and simulated cell growth
(q O2 ) based on data from CFD simulation (b)
208
V. Jossen et al.