

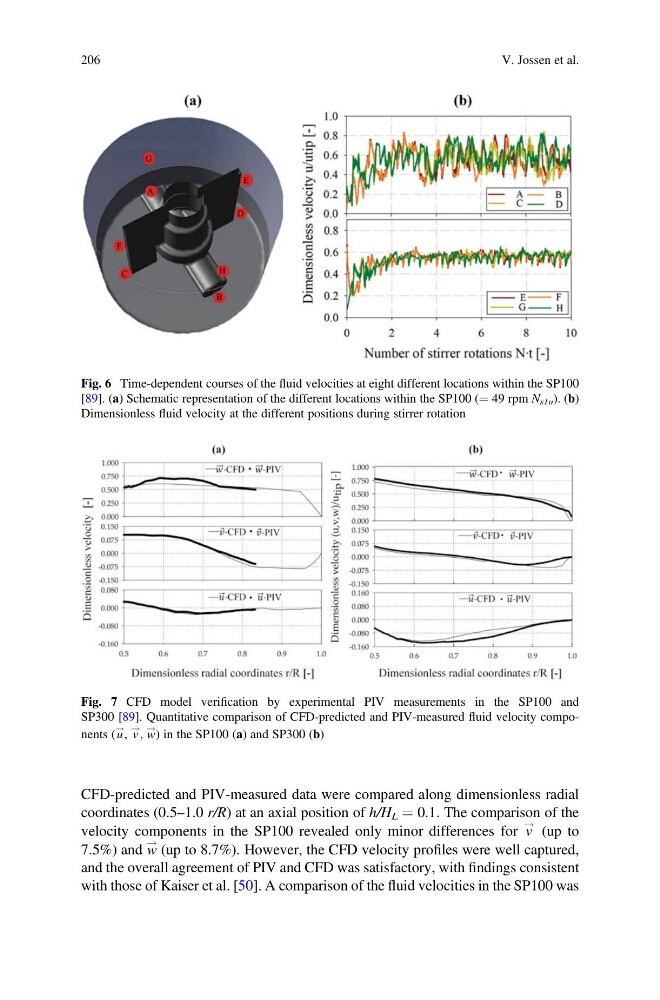
CFD-predicted and PIV-measured data were compared along dimensionless radial
coordinates (0.5–1.0 r/R) at an axial position of h/H L ¼ 0.1. The comparison of the
velocity components in the SP100 revealed only minor differences for v
! (up to
7.5%) and w
! (up to 8.7%). However, the CFD velocity profiles were well captured,
and the overall agreement of PIV and CFD was satisfactory, with findings consistent
with those of Kaiser et al. [50]. A comparison of the fluid velocities in the SP100 was
Fig. 6 Time-dependent courses of the fluid velocities at eight different locations within the SP100
[89]. (a) Schematic representation of the different locations within the SP100 (¼ 49 rpm N s1u ). (b)
Dimensionless fluid velocity at the different positions during stirrer rotation
Fig. 7 CFD model verification by experimental PIV measurements in the SP100 and
SP300 [89]. Quantitative comparison of CFD-predicted and PIV-measured fluid velocity components (u
!
, v
!
, w
! ) in the SP100 (a) and SP300 (b)
206
V. Jossen et al.
coordinates (0.5–1.0 r/R) at an axial position of h/H L ¼ 0.1. The comparison of the
velocity components in the SP100 revealed only minor differences for v
! (up to
7.5%) and w
! (up to 8.7%). However, the CFD velocity profiles were well captured,
and the overall agreement of PIV and CFD was satisfactory, with findings consistent
with those of Kaiser et al. [50]. A comparison of the fluid velocities in the SP100 was
Fig. 6 Time-dependent courses of the fluid velocities at eight different locations within the SP100
[89]. (a) Schematic representation of the different locations within the SP100 (¼ 49 rpm N s1u ). (b)
Dimensionless fluid velocity at the different positions during stirrer rotation
Fig. 7 CFD model verification by experimental PIV measurements in the SP100 and
SP300 [89]. Quantitative comparison of CFD-predicted and PIV-measured fluid velocity components (u
!
, v
!
, w
! ) in the SP100 (a) and SP300 (b)
206
V. Jossen et al.