

4.3 Online Ethanol Measurements
The online ethanol measurements were performed in a self-developed system
equipped with commercially available metal oxide semiconductor (MOS) gas sensors (TGS 822, TGS 813 and MQ3). The sensors were located in a measuring
chamber with a volume of 250 mL and operated in two cycles: a measurement
cycle and a washing cycle. During the measurement cycle, the headspace gas was
pumped into the measurement chamber for 10 s at a flow rate of 400 mL min
À1 with
a diaphragm pump (Schwarzer Precision, Essen, Germany). Then the chamber was
flushed by pure oxygen for regeneration. A peak-shaped measurement signal is
obtained, which was evaluated by using a chemometric model, which is described
in detail in the literature [69]. Therefore, every 5 min a new ethanol measurement
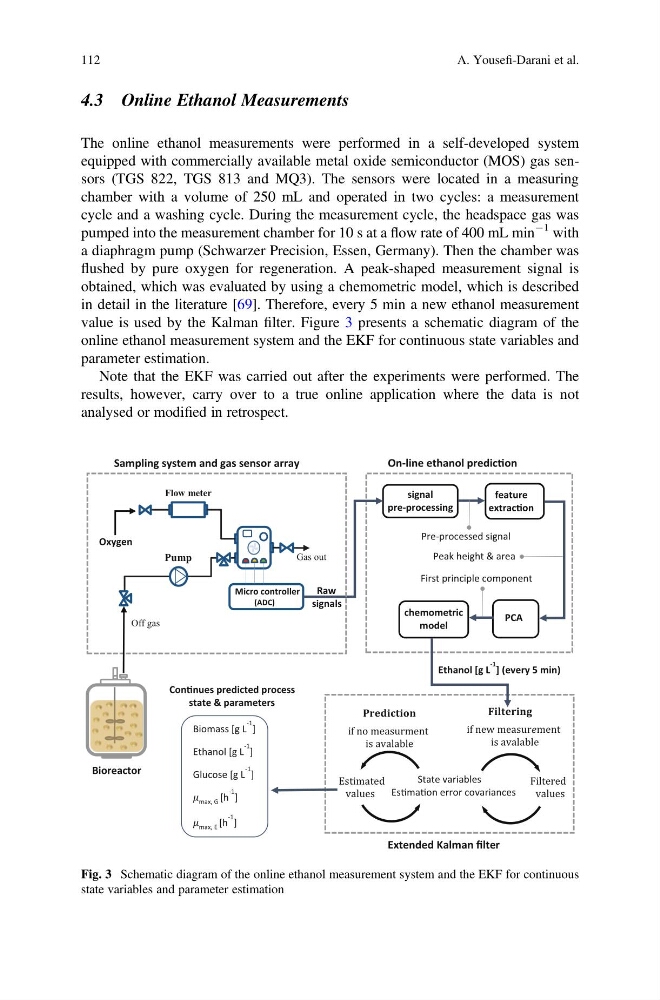
value is used by the Kalman filter. Figure 3 presents a schematic diagram of the
online ethanol measurement system and the EKF for continuous state variables and
parameter estimation.
Note that the EKF was carried out after the experiments were performed. The
results, however, carry over to a true online application where the data is not
analysed or modified in retrospect.
ConƟnues predicted process
state & parameters
Ethanol [g L
-1
] (every 5 min)
State variables
EsƟmaƟon error covariances
Filtered
values
Estimated
values
if no measurment
is avalable
if new measur ment
is avalable
Raw
signals
Flow meter
Micro controller
(ADC)
Oxygen
signal
pre-processing
PCA
chemometric
model
feature
extracƟon
Pre-processed signal
Peak height & area
First principle component
Extended Kalman filter
On-line ethanol predicƟon
Sampling system and gas sensor array
Off gas
Pump
Gas out
Biomass [g L
-1
]
Ethanol [g L
-1
]
Glucose [g L
-1 ]
max, G [h
-1 ]
max, E [h
-1 ]
Bioreactor
Fig. 3 Schematic diagram of the online ethanol measurement system and the EKF for continuous
state variables and parameter estimation
112
A. Yousefi-Darani et al.
The online ethanol measurements were performed in a self-developed system
equipped with commercially available metal oxide semiconductor (MOS) gas sensors (TGS 822, TGS 813 and MQ3). The sensors were located in a measuring
chamber with a volume of 250 mL and operated in two cycles: a measurement
cycle and a washing cycle. During the measurement cycle, the headspace gas was
pumped into the measurement chamber for 10 s at a flow rate of 400 mL min
À1 with
a diaphragm pump (Schwarzer Precision, Essen, Germany). Then the chamber was
flushed by pure oxygen for regeneration. A peak-shaped measurement signal is
obtained, which was evaluated by using a chemometric model, which is described
in detail in the literature [69]. Therefore, every 5 min a new ethanol measurement
value is used by the Kalman filter. Figure 3 presents a schematic diagram of the
online ethanol measurement system and the EKF for continuous state variables and
parameter estimation.
Note that the EKF was carried out after the experiments were performed. The
results, however, carry over to a true online application where the data is not
analysed or modified in retrospect.
ConƟnues predicted process
state & parameters
Ethanol [g L
-1
] (every 5 min)
State variables
EsƟmaƟon error covariances
Filtered
values
Estimated
values
if no measurment
is avalable
if new measur ment
is avalable
Raw
signals
Flow meter
Micro controller
(ADC)
Oxygen
signal
pre-processing
PCA
chemometric
model
feature
extracƟon
Pre-processed signal
Peak height & area
First principle component
Extended Kalman filter
On-line ethanol predicƟon
Sampling system and gas sensor array
Off gas
Pump
Gas out
Biomass [g L
-1
]
Ethanol [g L
-1
]
Glucose [g L
-1 ]
max, G [h
-1 ]
max, E [h
-1 ]
Bioreactor
Fig. 3 Schematic diagram of the online ethanol measurement system and the EKF for continuous
state variables and parameter estimation
112
A. Yousefi-Darani et al.