

3.2 Electromagnetism Analysis of Physical Anti-Collision …
87
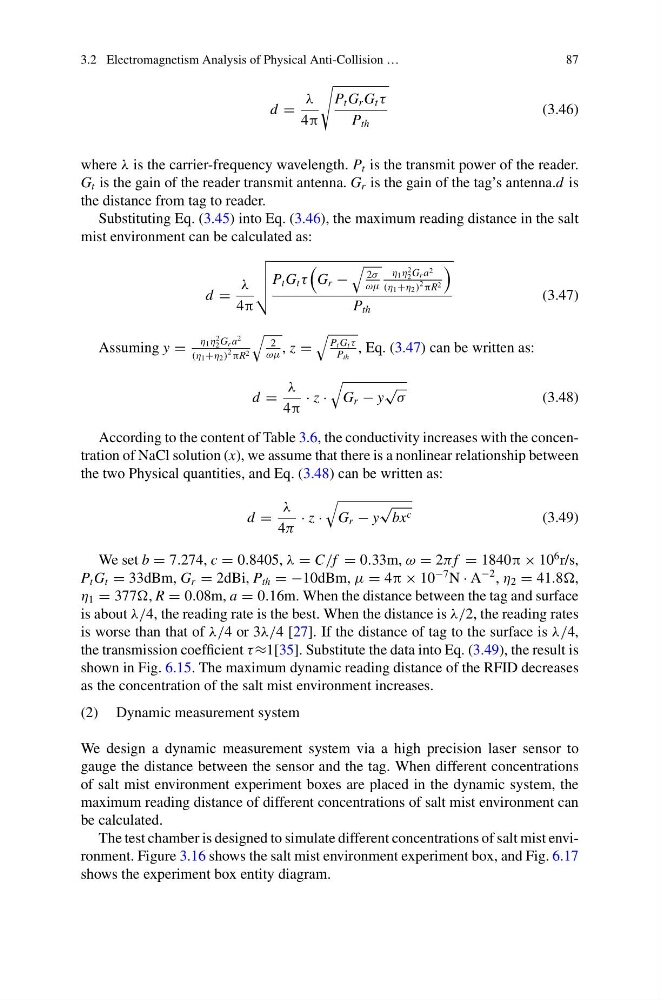
d =
λ
4π
P t G r G t τ
P th
(3.46)
where λ is the carrier-frequency wavelength. P t is the transmit power of the reader.
G t is the gain of the reader transmit antenna. G r is the gain of the tag’s antenna.d is
the distance from tag to reader.
Substituting Eq. (3.45) into Eq. (3.46), the maximum reading distance in the salt
mist environment can be calculated as:
d =
λ
4π
P t G t τ
G r −
2σ
ωμ
η 1 η
2
2 G r a 2
(η1+η2)
2 πR 2
P th
(3.47)
Assuming y =
η 1 η
2
2 G r a
2
(η1+η2)
2 πR 2
2
ωμ
, z =
P t G t τ
P th
, Eq. (3.47) can be written as:
d =
λ
4π
· z ·
G r − y
√ σ
(3.48)
According to the content of Table 3.6, the conductivity increases with the concentration of NaCl solution (x), we assume that there is a nonlinear relationship between
the two Physical quantities, and Eq. (3.48) can be written as:
d =
λ
4π
· z ·
G r − y
√
bx c
(3.49)
We set b = 7.274, c = 0.8405, λ = C/f = 0.33m, ω = 2π f = 1840π × 10
6 r/s,
P t G t = 33dBm, G r = 2dBi, P th = −10dBm, μ = 4π × 10
−7 N · A
−2 , η 2 = 41.8,
η 1 = 377, R = 0.08m, a = 0.16m. When the distance between the tag and surface
is about λ/4, the reading rate is the best. When the distance is λ/2, the reading rates
is worse than that of λ/4 or 3λ/4 [27]. If the distance of tag to the surface is λ/4,
the transmission coefficient τ ≈1[35]. Substitute the data into Eq. (3.49), the result is
shown in Fig. 6.15. The maximum dynamic reading distance of the RFID decreases
as the concentration of the salt mist environment increases.
(2) Dynamic measurement system
We design a dynamic measurement system via a high precision laser sensor to
gauge the distance between the sensor and the tag. When different concentrations
of salt mist environment experiment boxes are placed in the dynamic system, the
maximum reading distance of different concentrations of salt mist environment can
be calculated.
The test chamber is designed to simulate different concentrations of salt mist environment. Figure 3.16 shows the salt mist environment experiment box, and Fig. 6.17
shows the experiment box entity diagram.
87
d =
λ
4π
P t G r G t τ
P th
(3.46)
where λ is the carrier-frequency wavelength. P t is the transmit power of the reader.
G t is the gain of the reader transmit antenna. G r is the gain of the tag’s antenna.d is
the distance from tag to reader.
Substituting Eq. (3.45) into Eq. (3.46), the maximum reading distance in the salt
mist environment can be calculated as:
d =
λ
4π
P t G t τ
G r −
2σ
ωμ
η 1 η
2
2 G r a 2
(η1+η2)
2 πR 2
P th
(3.47)
Assuming y =
η 1 η
2
2 G r a
2
(η1+η2)
2 πR 2
2
ωμ
, z =
P t G t τ
P th
, Eq. (3.47) can be written as:
d =
λ
4π
· z ·
G r − y
√ σ
(3.48)
According to the content of Table 3.6, the conductivity increases with the concentration of NaCl solution (x), we assume that there is a nonlinear relationship between
the two Physical quantities, and Eq. (3.48) can be written as:
d =
λ
4π
· z ·
G r − y
√
bx c
(3.49)
We set b = 7.274, c = 0.8405, λ = C/f = 0.33m, ω = 2π f = 1840π × 10
6 r/s,
P t G t = 33dBm, G r = 2dBi, P th = −10dBm, μ = 4π × 10
−7 N · A
−2 , η 2 = 41.8,
η 1 = 377, R = 0.08m, a = 0.16m. When the distance between the tag and surface
is about λ/4, the reading rate is the best. When the distance is λ/2, the reading rates
is worse than that of λ/4 or 3λ/4 [27]. If the distance of tag to the surface is λ/4,
the transmission coefficient τ ≈1[35]. Substitute the data into Eq. (3.49), the result is
shown in Fig. 6.15. The maximum dynamic reading distance of the RFID decreases
as the concentration of the salt mist environment increases.
(2) Dynamic measurement system
We design a dynamic measurement system via a high precision laser sensor to
gauge the distance between the sensor and the tag. When different concentrations
of salt mist environment experiment boxes are placed in the dynamic system, the
maximum reading distance of different concentrations of salt mist environment can
be calculated.
The test chamber is designed to simulate different concentrations of salt mist environment. Figure 3.16 shows the salt mist environment experiment box, and Fig. 6.17
shows the experiment box entity diagram.