

3.1 Thermodynamic Analysis of Physical Anti-Collision …
71
The correlation coefficient R is an index to measure the linear correlation between
two random variables. R
2 is the determination coefficient. It represents how good the
correlation between the two random variables is. The larger these two coefficients
are, the better the correlation between the two variables is. From Fig. 3.8, we can see
that R
2 is more than 0.95, which means a good linear correlation between alcohol
concentration and corrected correlation coefficient. The standard error of calibration
SEC is a key to evaluate the quality of the model equation. The smaller the value of
SEC is, the better the equation is. From Fig. 3.8 we can see that the value of SEC is
very small, so the calibration error of the equation is also small. F is the significance
of the model and the linear relationship of the regression equation is significant while
F is large. In summary, the obtained model equation Eq. (3.12) has a good correlation
and a significant linear relationship.
(2) Predication of the reading distance of different temperatures
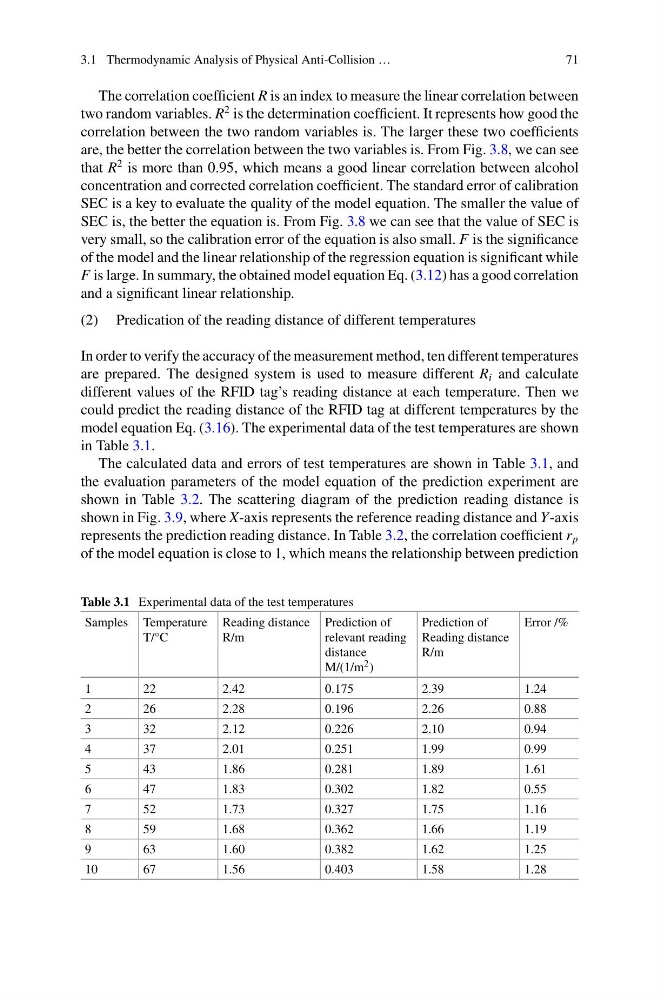
In order to verify the accuracy of the measurement method, ten different temperatures
are prepared. The designed system is used to measure different R i and calculate
different values of the RFID tag’s reading distance at each temperature. Then we
could predict the reading distance of the RFID tag at different temperatures by the
model equation Eq. (3.16). The experimental data of the test temperatures are shown
in Table 3.1.
The calculated data and errors of test temperatures are shown in Table 3.1, and
the evaluation parameters of the model equation of the prediction experiment are
shown in Table 3.2. The scattering diagram of the prediction reading distance is
shown in Fig. 3.9, where X-axis represents the reference reading distance and Y-axis
represents the prediction reading distance. In Table 3.2, the correlation coefficient r p
of the model equation is close to 1, which means the relationship between prediction
Table 3.1 Experimental data of the test temperatures
Samples Temperature
T/°C
Reading distance
R/m
Prediction of
relevant reading
distance
M/(1/m 2 )
Prediction of
Reading distance
R/m
Error /%
1
22
2.42
0.175
2.39
1.24
2
26
2.28
0.196
2.26
0.88
3
32
2.12
0.226
2.10
0.94
4
37
2.01
0.251
1.99
0.99
5
43
1.86
0.281
1.89
1.61
6
47
1.83
0.302
1.82
0.55
7
52
1.73
0.327
1.75
1.16
8
59
1.68
0.362
1.66
1.19
9
63
1.60
0.382
1.62
1.25
10
67
1.56
0.403
1.58
1.28
71
The correlation coefficient R is an index to measure the linear correlation between
two random variables. R
2 is the determination coefficient. It represents how good the
correlation between the two random variables is. The larger these two coefficients
are, the better the correlation between the two variables is. From Fig. 3.8, we can see
that R
2 is more than 0.95, which means a good linear correlation between alcohol
concentration and corrected correlation coefficient. The standard error of calibration
SEC is a key to evaluate the quality of the model equation. The smaller the value of
SEC is, the better the equation is. From Fig. 3.8 we can see that the value of SEC is
very small, so the calibration error of the equation is also small. F is the significance
of the model and the linear relationship of the regression equation is significant while
F is large. In summary, the obtained model equation Eq. (3.12) has a good correlation
and a significant linear relationship.
(2) Predication of the reading distance of different temperatures
In order to verify the accuracy of the measurement method, ten different temperatures
are prepared. The designed system is used to measure different R i and calculate
different values of the RFID tag’s reading distance at each temperature. Then we
could predict the reading distance of the RFID tag at different temperatures by the
model equation Eq. (3.16). The experimental data of the test temperatures are shown
in Table 3.1.
The calculated data and errors of test temperatures are shown in Table 3.1, and
the evaluation parameters of the model equation of the prediction experiment are
shown in Table 3.2. The scattering diagram of the prediction reading distance is
shown in Fig. 3.9, where X-axis represents the reference reading distance and Y-axis
represents the prediction reading distance. In Table 3.2, the correlation coefficient r p
of the model equation is close to 1, which means the relationship between prediction
Table 3.1 Experimental data of the test temperatures
Samples Temperature
T/°C
Reading distance
R/m
Prediction of
relevant reading
distance
M/(1/m 2 )
Prediction of
Reading distance
R/m
Error /%
1
22
2.42
0.175
2.39
1.24
2
26
2.28
0.196
2.26
0.88
3
32
2.12
0.226
2.10
0.94
4
37
2.01
0.251
1.99
0.99
5
43
1.86
0.281
1.89
1.61
6
47
1.83
0.302
1.82
0.55
7
52
1.73
0.327
1.75
1.16
8
59
1.68
0.362
1.66
1.19
9
63
1.60
0.382
1.62
1.25
10
67
1.56
0.403
1.58
1.28