

70
3 Physical Theory of RFID System Physical Anti-Collision
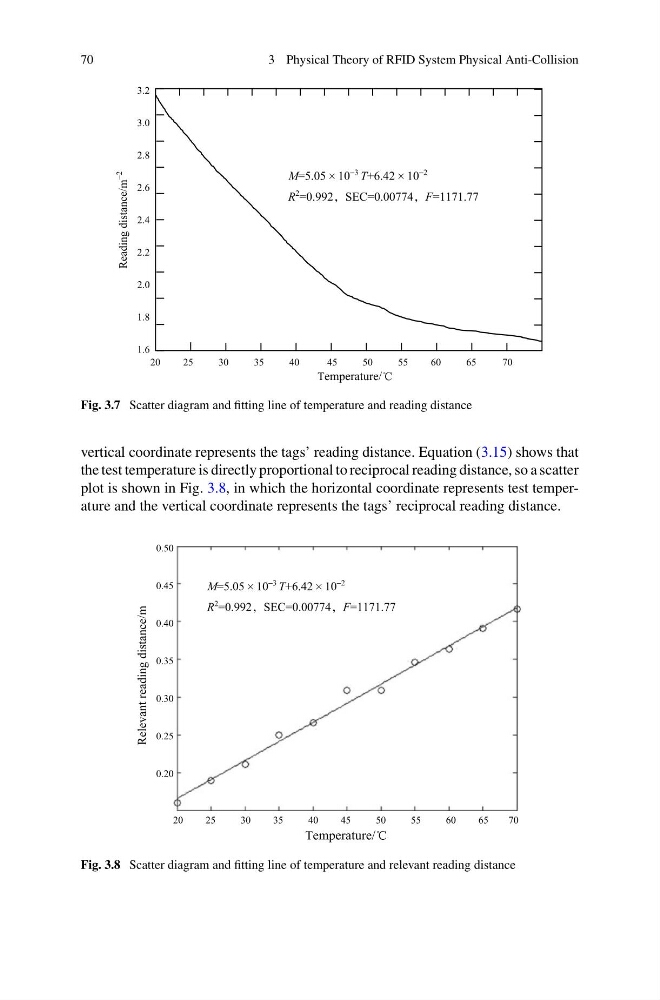
Fig. 3.7 Scatter diagram and fitting line of temperature and reading distance
vertical coordinate represents the tags’ reading distance. Equation (3.15) shows that
the test temperature is directly proportional to reciprocal reading distance, so a scatter
plot is shown in Fig. 3.8, in which the horizontal coordinate represents test temperature and the vertical coordinate represents the tags’ reciprocal reading distance.
Fig. 3.8 Scatter diagram and fitting line of temperature and relevant reading distance
3 Physical Theory of RFID System Physical Anti-Collision
Fig. 3.7 Scatter diagram and fitting line of temperature and reading distance
vertical coordinate represents the tags’ reading distance. Equation (3.15) shows that
the test temperature is directly proportional to reciprocal reading distance, so a scatter
plot is shown in Fig. 3.8, in which the horizontal coordinate represents test temperature and the vertical coordinate represents the tags’ reciprocal reading distance.
Fig. 3.8 Scatter diagram and fitting line of temperature and relevant reading distance