

6.7 Conclusion
235
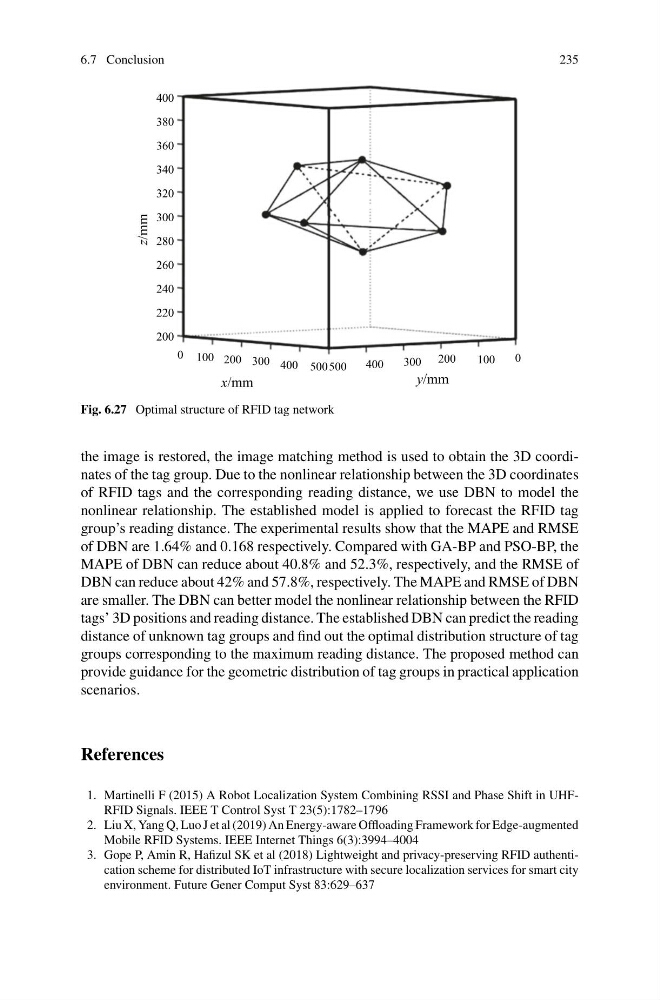
Fig. 6.27 Optimal structure of RFID tag network
the image is restored, the image matching method is used to obtain the 3D coordinates of the tag group. Due to the nonlinear relationship between the 3D coordinates
of RFID tags and the corresponding reading distance, we use DBN to model the
nonlinear relationship. The established model is applied to forecast the RFID tag
group’s reading distance. The experimental results show that the MAPE and RMSE
of DBN are 1.64% and 0.168 respectively. Compared with GA-BP and PSO-BP, the
MAPE of DBN can reduce about 40.8% and 52.3%, respectively, and the RMSE of
DBN can reduce about 42% and 57.8%, respectively. The MAPE and RMSE of DBN
are smaller. The DBN can better model the nonlinear relationship between the RFID
tags’ 3D positions and reading distance. The established DBN can predict the reading
distance of unknown tag groups and find out the optimal distribution structure of tag
groups corresponding to the maximum reading distance. The proposed method can
provide guidance for the geometric distribution of tag groups in practical application
scenarios.
References
1. Martinelli F (2015) A Robot Localization System Combining RSSI and Phase Shift in UHFRFID Signals. IEEE T Control Syst T 23(5):1782–1796
2. Liu X, Yang Q, Luo J et al (2019) An Energy-aware Offloading Framework for Edge-augmented
Mobile RFID Systems. IEEE Internet Things 6(3):3994–4004
3. Gope P, Amin R, Hafizul SK et al (2018) Lightweight and privacy-preserving RFID authentication scheme for distributed IoT infrastructure with secure localization services for smart city
environment. Future Gener Comput Syst 83:629–637
235
Fig. 6.27 Optimal structure of RFID tag network
the image is restored, the image matching method is used to obtain the 3D coordinates of the tag group. Due to the nonlinear relationship between the 3D coordinates
of RFID tags and the corresponding reading distance, we use DBN to model the
nonlinear relationship. The established model is applied to forecast the RFID tag
group’s reading distance. The experimental results show that the MAPE and RMSE
of DBN are 1.64% and 0.168 respectively. Compared with GA-BP and PSO-BP, the
MAPE of DBN can reduce about 40.8% and 52.3%, respectively, and the RMSE of
DBN can reduce about 42% and 57.8%, respectively. The MAPE and RMSE of DBN
are smaller. The DBN can better model the nonlinear relationship between the RFID
tags’ 3D positions and reading distance. The established DBN can predict the reading
distance of unknown tag groups and find out the optimal distribution structure of tag
groups corresponding to the maximum reading distance. The proposed method can
provide guidance for the geometric distribution of tag groups in practical application
scenarios.
References
1. Martinelli F (2015) A Robot Localization System Combining RSSI and Phase Shift in UHFRFID Signals. IEEE T Control Syst T 23(5):1782–1796
2. Liu X, Yang Q, Luo J et al (2019) An Energy-aware Offloading Framework for Edge-augmented
Mobile RFID Systems. IEEE Internet Things 6(3):3994–4004
3. Gope P, Amin R, Hafizul SK et al (2018) Lightweight and privacy-preserving RFID authentication scheme for distributed IoT infrastructure with secure localization services for smart city
environment. Future Gener Comput Syst 83:629–637