

5.3 Physical Anti-Collision Based on Wavelet
195
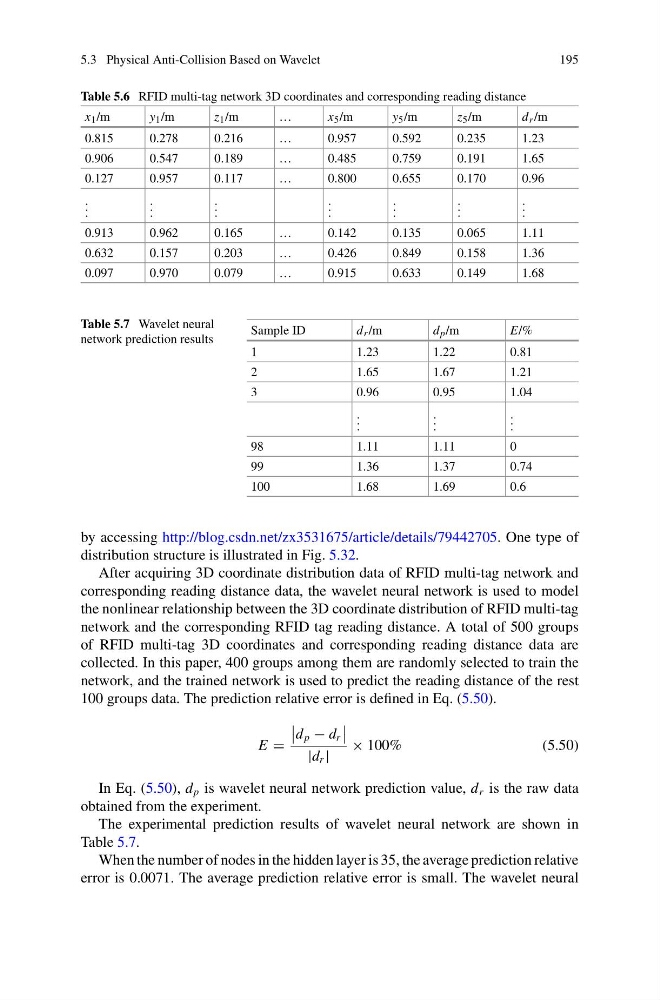
Table 5.6 RFID multi-tag network 3D coordinates and corresponding reading distance
x 1 /m
y 1 /m
z 1 /m
…
x 5 /m
y 5 /m
z 5 /m
d r /m
0.815
0.278
0.216
…
0.957
0.592
0.235
1.23
0.906
0.547
0.189
…
0.485
0.759
0.191
1.65
0.127
0.957
0.117
…
0.800
0.655
0.170
0.96
. . .
. . .
. . .
. . .
. . .
. . .
. . .
0.913
0.962
0.165
…
0.142
0.135
0.065
1.11
0.632
0.157
0.203
…
0.426
0.849
0.158
1.36
0.097
0.970
0.079
…
0.915
0.633
0.149
1.68
Table 5.7 Wavelet neural
network prediction results
Sample ID
d r /m
d p /m
E/%
1
1.23
1.22
0.81
2
1.65
1.67
1.21
3
0.96
0.95
1.04
. . .
. . .
. . .
98
1.11
1.11
0
99
1.36
1.37
0.74
100
1.68
1.69
0.6
by accessing http://blog.csdn.net/zx3531675/article/details/79442705. One type of
distribution structure is illustrated in Fig. 5.32.
After acquiring 3D coordinate distribution data of RFID multi-tag network and
corresponding reading distance data, the wavelet neural network is used to model
the nonlinear relationship between the 3D coordinate distribution of RFID multi-tag
network and the corresponding RFID tag reading distance. A total of 500 groups
of RFID multi-tag 3D coordinates and corresponding reading distance data are
collected. In this paper, 400 groups among them are randomly selected to train the
network, and the trained network is used to predict the reading distance of the rest
100 groups data. The prediction relative error is defined in Eq. (5.50).
E =
d p − d r
|d r |
× 100%
(5.50)
In Eq. (5.50), d p is wavelet neural network prediction value, d r is the raw data
obtained from the experiment.
The experimental prediction results of wavelet neural network are shown in
Table 5.7.
When the number of nodes in the hidden layer is 35, the average prediction relative
error is 0.0071. The average prediction relative error is small. The wavelet neural
195
Table 5.6 RFID multi-tag network 3D coordinates and corresponding reading distance
x 1 /m
y 1 /m
z 1 /m
…
x 5 /m
y 5 /m
z 5 /m
d r /m
0.815
0.278
0.216
…
0.957
0.592
0.235
1.23
0.906
0.547
0.189
…
0.485
0.759
0.191
1.65
0.127
0.957
0.117
…
0.800
0.655
0.170
0.96
. . .
. . .
. . .
. . .
. . .
. . .
. . .
0.913
0.962
0.165
…
0.142
0.135
0.065
1.11
0.632
0.157
0.203
…
0.426
0.849
0.158
1.36
0.097
0.970
0.079
…
0.915
0.633
0.149
1.68
Table 5.7 Wavelet neural
network prediction results
Sample ID
d r /m
d p /m
E/%
1
1.23
1.22
0.81
2
1.65
1.67
1.21
3
0.96
0.95
1.04
. . .
. . .
. . .
98
1.11
1.11
0
99
1.36
1.37
0.74
100
1.68
1.69
0.6
by accessing http://blog.csdn.net/zx3531675/article/details/79442705. One type of
distribution structure is illustrated in Fig. 5.32.
After acquiring 3D coordinate distribution data of RFID multi-tag network and
corresponding reading distance data, the wavelet neural network is used to model
the nonlinear relationship between the 3D coordinate distribution of RFID multi-tag
network and the corresponding RFID tag reading distance. A total of 500 groups
of RFID multi-tag 3D coordinates and corresponding reading distance data are
collected. In this paper, 400 groups among them are randomly selected to train the
network, and the trained network is used to predict the reading distance of the rest
100 groups data. The prediction relative error is defined in Eq. (5.50).
E =
d p − d r
|d r |
× 100%
(5.50)
In Eq. (5.50), d p is wavelet neural network prediction value, d r is the raw data
obtained from the experiment.
The experimental prediction results of wavelet neural network are shown in
Table 5.7.
When the number of nodes in the hidden layer is 35, the average prediction relative
error is 0.0071. The average prediction relative error is small. The wavelet neural