

3.4 Mechanical Tests
69
Tensile tests are primarily used for bulk or self-supporting materials. Therefore,
coating can be studied either after the removal of the substrate or on a substrate that
is much thinner (and weaker) than the coating itself. The appearance of the stress vs.
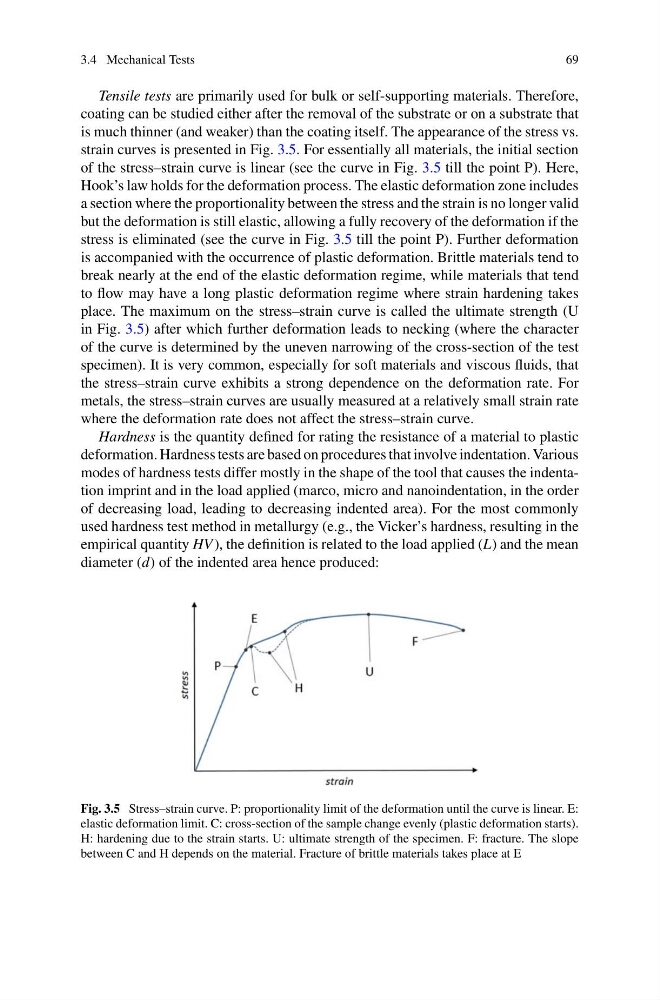
strain curves is presented in Fig. 3.5. For essentially all materials, the initial section
of the stress–strain curve is linear (see the curve in Fig. 3.5 till the point P). Here,
Hook’s law holds for the deformation process. The elastic deformation zone includes
a section where the proportionality between the stress and the strain is no longer valid
but the deformation is still elastic, allowing a fully recovery of the deformation if the
stress is eliminated (see the curve in Fig. 3.5 till the point P). Further deformation
is accompanied with the occurrence of plastic deformation. Brittle materials tend to
break nearly at the end of the elastic deformation regime, while materials that tend
to flow may have a long plastic deformation regime where strain hardening takes
place. The maximum on the stress–strain curve is called the ultimate strength (U
in Fig. 3.5) after which further deformation leads to necking (where the character
of the curve is determined by the uneven narrowing of the cross-section of the test
specimen). It is very common, especially for soft materials and viscous fluids, that
the stress–strain curve exhibits a strong dependence on the deformation rate. For
metals, the stress–strain curves are usually measured at a relatively small strain rate
where the deformation rate does not affect the stress–strain curve.
Hardness is the quantity defined for rating the resistance of a material to plastic
deformation. Hardness tests are based on procedures that involve indentation. Various
modes of hardness tests differ mostly in the shape of the tool that causes the indentation imprint and in the load applied (marco, micro and nanoindentation, in the order
of decreasing load, leading to decreasing indented area). For the most commonly
used hardness test method in metallurgy (e.g., the Vicker’s hardness, resulting in the
empirical quantity HV ), the definition is related to the load applied (L) and the mean
diameter (d) of the indented area hence produced:
Fig. 3.5 Stress–strain curve. P: proportionality limit of the deformation until the curve is linear. E:
elastic deformation limit. C: cross-section of the sample change evenly (plastic deformation starts).
H: hardening due to the strain starts. U: ultimate strength of the specimen. F: fracture. The slope
between C and H depends on the material. Fracture of brittle materials takes place at E
69
Tensile tests are primarily used for bulk or self-supporting materials. Therefore,
coating can be studied either after the removal of the substrate or on a substrate that
is much thinner (and weaker) than the coating itself. The appearance of the stress vs.
strain curves is presented in Fig. 3.5. For essentially all materials, the initial section
of the stress–strain curve is linear (see the curve in Fig. 3.5 till the point P). Here,
Hook’s law holds for the deformation process. The elastic deformation zone includes
a section where the proportionality between the stress and the strain is no longer valid
but the deformation is still elastic, allowing a fully recovery of the deformation if the
stress is eliminated (see the curve in Fig. 3.5 till the point P). Further deformation
is accompanied with the occurrence of plastic deformation. Brittle materials tend to
break nearly at the end of the elastic deformation regime, while materials that tend
to flow may have a long plastic deformation regime where strain hardening takes
place. The maximum on the stress–strain curve is called the ultimate strength (U
in Fig. 3.5) after which further deformation leads to necking (where the character
of the curve is determined by the uneven narrowing of the cross-section of the test
specimen). It is very common, especially for soft materials and viscous fluids, that
the stress–strain curve exhibits a strong dependence on the deformation rate. For
metals, the stress–strain curves are usually measured at a relatively small strain rate
where the deformation rate does not affect the stress–strain curve.
Hardness is the quantity defined for rating the resistance of a material to plastic
deformation. Hardness tests are based on procedures that involve indentation. Various
modes of hardness tests differ mostly in the shape of the tool that causes the indentation imprint and in the load applied (marco, micro and nanoindentation, in the order
of decreasing load, leading to decreasing indented area). For the most commonly
used hardness test method in metallurgy (e.g., the Vicker’s hardness, resulting in the
empirical quantity HV ), the definition is related to the load applied (L) and the mean
diameter (d) of the indented area hence produced:
Fig. 3.5 Stress–strain curve. P: proportionality limit of the deformation until the curve is linear. E:
elastic deformation limit. C: cross-section of the sample change evenly (plastic deformation starts).
H: hardening due to the strain starts. U: ultimate strength of the specimen. F: fracture. The slope
between C and H depends on the material. Fracture of brittle materials takes place at E