

12.3 Deposition at the Liquid–Liquid Interface
443
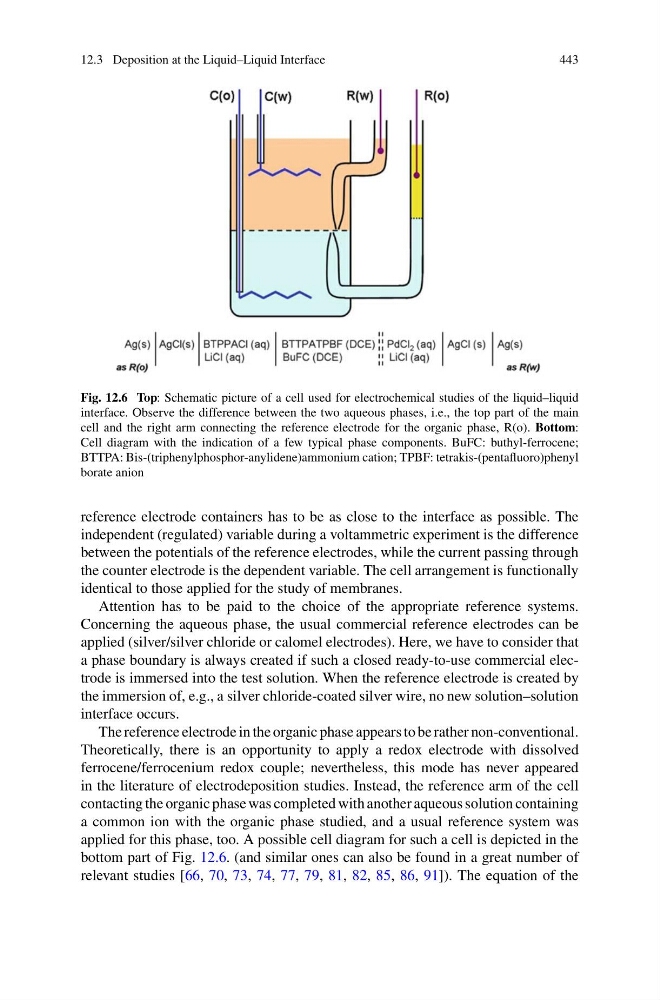
Fig. 12.6 Top: Schematic picture of a cell used for electrochemical studies of the liquid–liquid
interface. Observe the difference between the two aqueous phases, i.e., the top part of the main
cell and the right arm connecting the reference electrode for the organic phase, R(o). Bottom:
Cell diagram with the indication of a few typical phase components. BuFC: buthyl-ferrocene;
BTTPA: Bis-(triphenylphosphor-anylidene)ammonium cation; TPBF: tetrakis-(pentafluoro)phenyl
borate anion
reference electrode containers has to be as close to the interface as possible. The
independent (regulated) variable during a voltammetric experiment is the difference
between the potentials of the reference electrodes, while the current passing through
the counter electrode is the dependent variable. The cell arrangement is functionally
identical to those applied for the study of membranes.
Attention has to be paid to the choice of the appropriate reference systems.
Concerning the aqueous phase, the usual commercial reference electrodes can be
applied (silver/silver chloride or calomel electrodes). Here, we have to consider that
a phase boundary is always created if such a closed ready-to-use commercial electrode is immersed into the test solution. When the reference electrode is created by
the immersion of, e.g., a silver chloride-coated silver wire, no new solution–solution
interface occurs.
The reference electrode in the organic phase appears to be rather non-conventional.
Theoretically, there is an opportunity to apply a redox electrode with dissolved
ferrocene/ferrocenium redox couple; nevertheless, this mode has never appeared
in the literature of electrodeposition studies. Instead, the reference arm of the cell
contacting the organic phase was completed with another aqueous solution containing
a common ion with the organic phase studied, and a usual reference system was
applied for this phase, too. A possible cell diagram for such a cell is depicted in the
bottom part of Fig. 12.6. (and similar ones can also be found in a great number of
relevant studies [66, 70, 73, 74, 77, 79, 81, 82, 85, 86, 91]). The equation of the
443
Fig. 12.6 Top: Schematic picture of a cell used for electrochemical studies of the liquid–liquid
interface. Observe the difference between the two aqueous phases, i.e., the top part of the main
cell and the right arm connecting the reference electrode for the organic phase, R(o). Bottom:
Cell diagram with the indication of a few typical phase components. BuFC: buthyl-ferrocene;
BTTPA: Bis-(triphenylphosphor-anylidene)ammonium cation; TPBF: tetrakis-(pentafluoro)phenyl
borate anion
reference electrode containers has to be as close to the interface as possible. The
independent (regulated) variable during a voltammetric experiment is the difference
between the potentials of the reference electrodes, while the current passing through
the counter electrode is the dependent variable. The cell arrangement is functionally
identical to those applied for the study of membranes.
Attention has to be paid to the choice of the appropriate reference systems.
Concerning the aqueous phase, the usual commercial reference electrodes can be
applied (silver/silver chloride or calomel electrodes). Here, we have to consider that
a phase boundary is always created if such a closed ready-to-use commercial electrode is immersed into the test solution. When the reference electrode is created by
the immersion of, e.g., a silver chloride-coated silver wire, no new solution–solution
interface occurs.
The reference electrode in the organic phase appears to be rather non-conventional.
Theoretically, there is an opportunity to apply a redox electrode with dissolved
ferrocene/ferrocenium redox couple; nevertheless, this mode has never appeared
in the literature of electrodeposition studies. Instead, the reference arm of the cell
contacting the organic phase was completed with another aqueous solution containing
a common ion with the organic phase studied, and a usual reference system was
applied for this phase, too. A possible cell diagram for such a cell is depicted in the
bottom part of Fig. 12.6. (and similar ones can also be found in a great number of
relevant studies [66, 70, 73, 74, 77, 79, 81, 82, 85, 86, 91]). The equation of the