

12.1 Electrodeposition in Ultrathin Solution Layers Along the Edge of the Cell
427
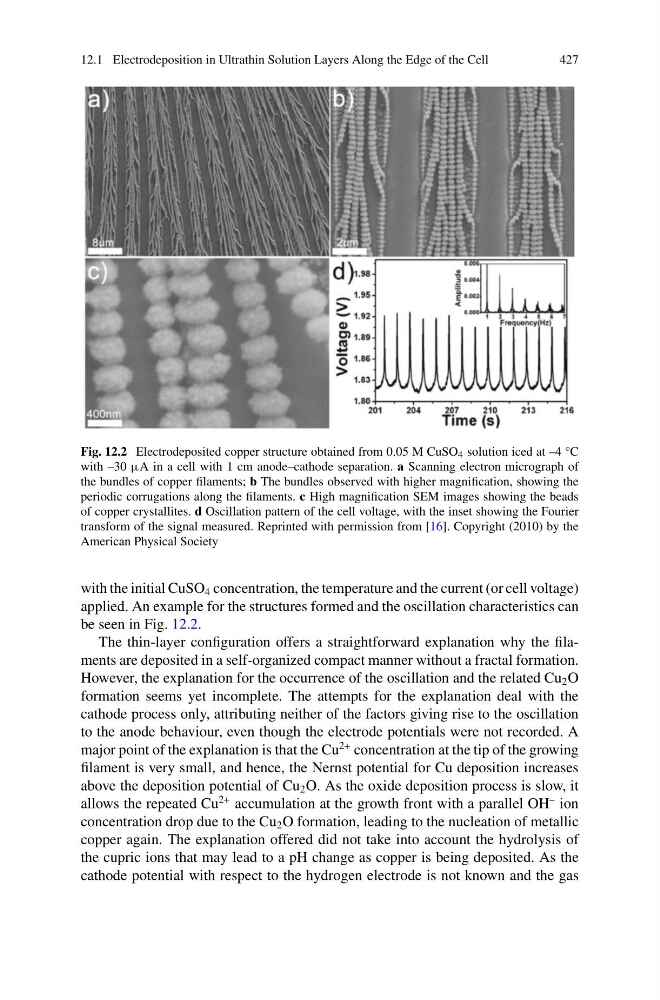
Fig. 12.2 Electrodeposited copper structure obtained from 0.05 M CuSO 4 solution iced at –4 °C
with –30 µA in a cell with 1 cm anode–cathode separation. a Scanning electron micrograph of
the bundles of copper filaments; b The bundles observed with higher magnification, showing the
periodic corrugations along the filaments. c High magnification SEM images showing the beads
of copper crystallites. d Oscillation pattern of the cell voltage, with the inset showing the Fourier
transform of the signal measured. Reprinted with permission from [16]. Copyright (2010) by the
American Physical Society
with the initial CuSO 4 concentration, the temperature and the current (or cell voltage)
applied. An example for the structures formed and the oscillation characteristics can
be seen in Fig. 12.2.
The thin-layer configuration offers a straightforward explanation why the filaments are deposited in a self-organized compact manner without a fractal formation.
However, the explanation for the occurrence of the oscillation and the related Cu 2 O
formation seems yet incomplete. The attempts for the explanation deal with the
cathode process only, attributing neither of the factors giving rise to the oscillation
to the anode behaviour, even though the electrode potentials were not recorded. A
major point of the explanation is that the Cu
2+ concentration at the tip of the growing
filament is very small, and hence, the Nernst potential for Cu deposition increases
above the deposition potential of Cu 2 O. As the oxide deposition process is slow, it
allows the repeated Cu
2+ accumulation at the growth front with a parallel OH
– ion
concentration drop due to the Cu 2 O formation, leading to the nucleation of metallic
copper again. The explanation offered did not take into account the hydrolysis of
the cupric ions that may lead to a pH change as copper is being deposited. As the
cathode potential with respect to the hydrogen electrode is not known and the gas
427
Fig. 12.2 Electrodeposited copper structure obtained from 0.05 M CuSO 4 solution iced at –4 °C
with –30 µA in a cell with 1 cm anode–cathode separation. a Scanning electron micrograph of
the bundles of copper filaments; b The bundles observed with higher magnification, showing the
periodic corrugations along the filaments. c High magnification SEM images showing the beads
of copper crystallites. d Oscillation pattern of the cell voltage, with the inset showing the Fourier
transform of the signal measured. Reprinted with permission from [16]. Copyright (2010) by the
American Physical Society
with the initial CuSO 4 concentration, the temperature and the current (or cell voltage)
applied. An example for the structures formed and the oscillation characteristics can
be seen in Fig. 12.2.
The thin-layer configuration offers a straightforward explanation why the filaments are deposited in a self-organized compact manner without a fractal formation.
However, the explanation for the occurrence of the oscillation and the related Cu 2 O
formation seems yet incomplete. The attempts for the explanation deal with the
cathode process only, attributing neither of the factors giving rise to the oscillation
to the anode behaviour, even though the electrode potentials were not recorded. A
major point of the explanation is that the Cu
2+ concentration at the tip of the growing
filament is very small, and hence, the Nernst potential for Cu deposition increases
above the deposition potential of Cu 2 O. As the oxide deposition process is slow, it
allows the repeated Cu
2+ accumulation at the growth front with a parallel OH
– ion
concentration drop due to the Cu 2 O formation, leading to the nucleation of metallic
copper again. The explanation offered did not take into account the hydrolysis of
the cupric ions that may lead to a pH change as copper is being deposited. As the
cathode potential with respect to the hydrogen electrode is not known and the gas