

426
12 Localized or Spatially Selective Electrodeposition Methods
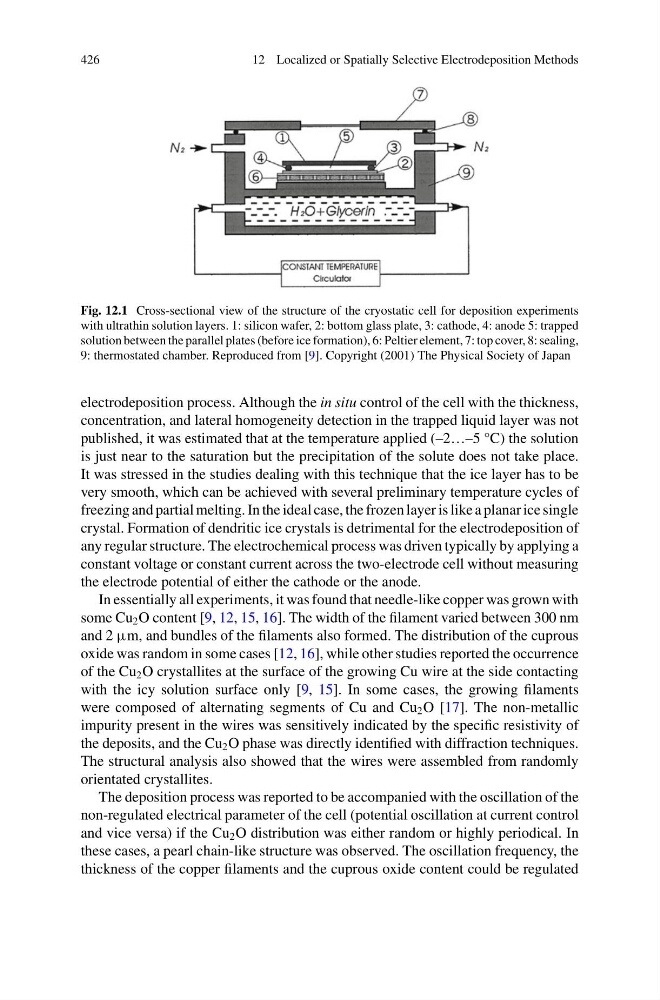
Fig. 12.1 Cross-sectional view of the structure of the cryostatic cell for deposition experiments
with ultrathin solution layers. 1: silicon wafer, 2: bottom glass plate, 3: cathode, 4: anode 5: trapped
solution between the parallel plates (before ice formation), 6: Peltier element, 7: top cover, 8: sealing,
9: thermostated chamber. Reproduced from [9]. Copyright (2001) The Physical Society of Japan
electrodeposition process. Although the in situ control of the cell with the thickness,
concentration, and lateral homogeneity detection in the trapped liquid layer was not
published, it was estimated that at the temperature applied (–2…–5 °C) the solution
is just near to the saturation but the precipitation of the solute does not take place.
It was stressed in the studies dealing with this technique that the ice layer has to be
very smooth, which can be achieved with several preliminary temperature cycles of
freezing and partial melting. In the ideal case, the frozen layer is like a planar ice single
crystal. Formation of dendritic ice crystals is detrimental for the electrodeposition of
any regular structure. The electrochemical process was driven typically by applying a
constant voltage or constant current across the two-electrode cell without measuring
the electrode potential of either the cathode or the anode.
In essentially all experiments, it was found that needle-like copper was grown with
some Cu 2 O content [9, 12, 15, 16]. The width of the filament varied between 300 nm
and 2 µm, and bundles of the filaments also formed. The distribution of the cuprous
oxide was random in some cases [12, 16], while other studies reported the occurrence
of the Cu 2 O crystallites at the surface of the growing Cu wire at the side contacting
with the icy solution surface only [9, 15]. In some cases, the growing filaments
were composed of alternating segments of Cu and Cu 2 O [17]. The non-metallic
impurity present in the wires was sensitively indicated by the specific resistivity of
the deposits, and the Cu 2 O phase was directly identified with diffraction techniques.
The structural analysis also showed that the wires were assembled from randomly
orientated crystallites.
The deposition process was reported to be accompanied with the oscillation of the
non-regulated electrical parameter of the cell (potential oscillation at current control
and vice versa) if the Cu 2 O distribution was either random or highly periodical. In
these cases, a pearl chain-like structure was observed. The oscillation frequency, the
thickness of the copper filaments and the cuprous oxide content could be regulated
12 Localized or Spatially Selective Electrodeposition Methods
Fig. 12.1 Cross-sectional view of the structure of the cryostatic cell for deposition experiments
with ultrathin solution layers. 1: silicon wafer, 2: bottom glass plate, 3: cathode, 4: anode 5: trapped
solution between the parallel plates (before ice formation), 6: Peltier element, 7: top cover, 8: sealing,
9: thermostated chamber. Reproduced from [9]. Copyright (2001) The Physical Society of Japan
electrodeposition process. Although the in situ control of the cell with the thickness,
concentration, and lateral homogeneity detection in the trapped liquid layer was not
published, it was estimated that at the temperature applied (–2…–5 °C) the solution
is just near to the saturation but the precipitation of the solute does not take place.
It was stressed in the studies dealing with this technique that the ice layer has to be
very smooth, which can be achieved with several preliminary temperature cycles of
freezing and partial melting. In the ideal case, the frozen layer is like a planar ice single
crystal. Formation of dendritic ice crystals is detrimental for the electrodeposition of
any regular structure. The electrochemical process was driven typically by applying a
constant voltage or constant current across the two-electrode cell without measuring
the electrode potential of either the cathode or the anode.
In essentially all experiments, it was found that needle-like copper was grown with
some Cu 2 O content [9, 12, 15, 16]. The width of the filament varied between 300 nm
and 2 µm, and bundles of the filaments also formed. The distribution of the cuprous
oxide was random in some cases [12, 16], while other studies reported the occurrence
of the Cu 2 O crystallites at the surface of the growing Cu wire at the side contacting
with the icy solution surface only [9, 15]. In some cases, the growing filaments
were composed of alternating segments of Cu and Cu 2 O [17]. The non-metallic
impurity present in the wires was sensitively indicated by the specific resistivity of
the deposits, and the Cu 2 O phase was directly identified with diffraction techniques.
The structural analysis also showed that the wires were assembled from randomly
orientated crystallites.
The deposition process was reported to be accompanied with the oscillation of the
non-regulated electrical parameter of the cell (potential oscillation at current control
and vice versa) if the Cu 2 O distribution was either random or highly periodical. In
these cases, a pearl chain-like structure was observed. The oscillation frequency, the
thickness of the copper filaments and the cuprous oxide content could be regulated