

2.8 Basic Electrode Kinetics
23
j TOTAL = j A + j C = k A c
0
RED zF exp(αzFE/RT )
− k C c
0
Ox zF exp(−(1 − α)zFE/RT )
(2.12)
For the above equation, it was applied that j = zFv, and that the changes of the
activation energy of the anode and cathode reactions as a result of the electrode
potential change are not independent. The asymmetry parameter α is often close to
0.5, and the zero in the superscript of the concentrations indicates that their value right
at the electrode surface should be considered. This chapter deals with the case where
the surface concentration of the reactant can be taken equal to the bulk concentration,
and the impact of the transport processes will be discussed later.
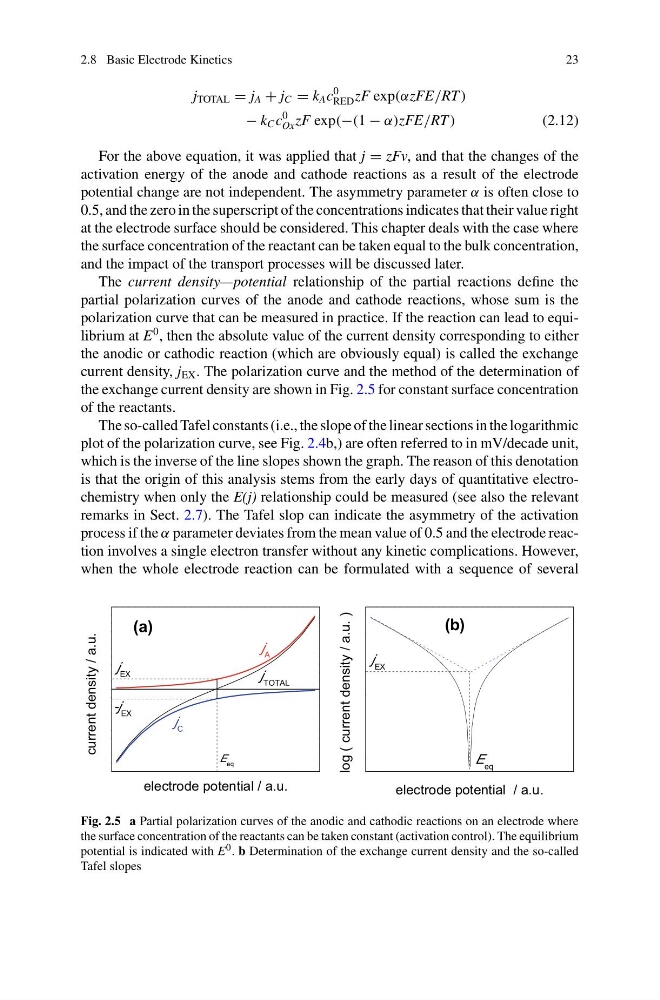
The current density—potential relationship of the partial reactions define the
partial polarization curves of the anode and cathode reactions, whose sum is the
polarization curve that can be measured in practice. If the reaction can lead to equilibrium at E
0 , then the absolute value of the current density corresponding to either
the anodic or cathodic reaction (which are obviously equal) is called the exchange
current density, j EX . The polarization curve and the method of the determination of
the exchange current density are shown in Fig. 2.5 for constant surface concentration
of the reactants.
The so-called Tafel constants (i.e., the slope of the linear sections in the logarithmic
plot of the polarization curve, see Fig. 2.4b,) are often referred to in mV/decade unit,
which is the inverse of the line slopes shown the graph. The reason of this denotation
is that the origin of this analysis stems from the early days of quantitative electrochemistry when only the E(j) relationship could be measured (see also the relevant
remarks in Sect. 2.7). The Tafel slop can indicate the asymmetry of the activation
process if the α parameter deviates from the mean value of 0.5 and the electrode reaction involves a single electron transfer without any kinetic complications. However,
when the whole electrode reaction can be formulated with a sequence of several
j EX
-j EX
j C
j TOTAL
E eq
current density / a.u.
electrode potential / a.u.
j A
(a)
(b)
E eq
j EX
log ( current density / a.u. )
electrode potential / a.u.
Fig. 2.5 a Partial polarization curves of the anodic and cathodic reactions on an electrode where
the surface concentration of the reactants can be taken constant (activation control). The equilibrium
potential is indicated with E 0 . b Determination of the exchange current density and the so-called
Tafel slopes
23
j TOTAL = j A + j C = k A c
0
RED zF exp(αzFE/RT )
− k C c
0
Ox zF exp(−(1 − α)zFE/RT )
(2.12)
For the above equation, it was applied that j = zFv, and that the changes of the
activation energy of the anode and cathode reactions as a result of the electrode
potential change are not independent. The asymmetry parameter α is often close to
0.5, and the zero in the superscript of the concentrations indicates that their value right
at the electrode surface should be considered. This chapter deals with the case where
the surface concentration of the reactant can be taken equal to the bulk concentration,
and the impact of the transport processes will be discussed later.
The current density—potential relationship of the partial reactions define the
partial polarization curves of the anode and cathode reactions, whose sum is the
polarization curve that can be measured in practice. If the reaction can lead to equilibrium at E
0 , then the absolute value of the current density corresponding to either
the anodic or cathodic reaction (which are obviously equal) is called the exchange
current density, j EX . The polarization curve and the method of the determination of
the exchange current density are shown in Fig. 2.5 for constant surface concentration
of the reactants.
The so-called Tafel constants (i.e., the slope of the linear sections in the logarithmic
plot of the polarization curve, see Fig. 2.4b,) are often referred to in mV/decade unit,
which is the inverse of the line slopes shown the graph. The reason of this denotation
is that the origin of this analysis stems from the early days of quantitative electrochemistry when only the E(j) relationship could be measured (see also the relevant
remarks in Sect. 2.7). The Tafel slop can indicate the asymmetry of the activation
process if the α parameter deviates from the mean value of 0.5 and the electrode reaction involves a single electron transfer without any kinetic complications. However,
when the whole electrode reaction can be formulated with a sequence of several
j EX
-j EX
j C
j TOTAL
E eq
current density / a.u.
electrode potential / a.u.
j A
(a)
(b)
E eq
j EX
log ( current density / a.u. )
electrode potential / a.u.
Fig. 2.5 a Partial polarization curves of the anodic and cathodic reactions on an electrode where
the surface concentration of the reactants can be taken constant (activation control). The equilibrium
potential is indicated with E 0 . b Determination of the exchange current density and the so-called
Tafel slopes