

286
8 Porous Nanostructured Materials
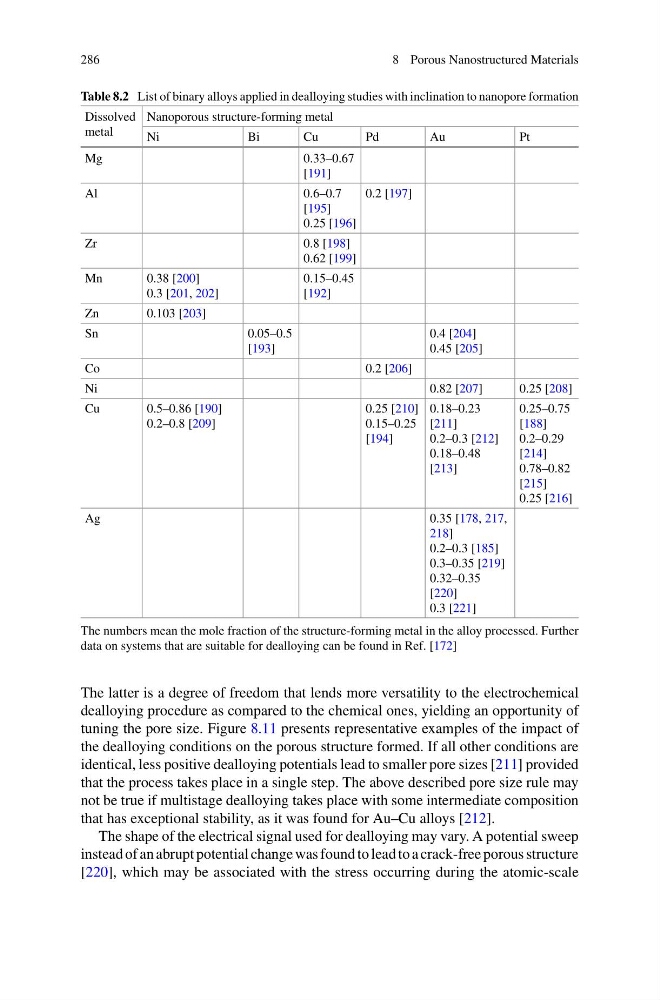
Table 8.2 List of binary alloys applied in dealloying studies with inclination to nanopore formation
Dissolved
metal
Nanoporous structure-forming metal
Ni
Bi
Cu
Pd
Au
Pt
Mg
0.33–0.67
[191]
Al
0.6–0.7
[195]
0.25 [196]
0.2 [197]
Zr
0.8 [198]
0.62 [199]
Mn
0.38 [200]
0.3 [201, 202]
0.15–0.45
[192]
Zn
0.103 [203]
Sn
0.05–0.5
[193]
0.4 [204]
0.45 [205]
Co
0.2 [206]
Ni
0.82 [207]
0.25 [208]
Cu
0.5–0.86 [190]
0.2–0.8 [209]
0.25 [210]
0.15–0.25
[194]
0.18–0.23
[211]
0.2–0.3 [212]
0.18–0.48
[213]
0.25–0.75
[188]
0.2–0.29
[214]
0.78–0.82
[215]
0.25 [216]
Ag
0.35 [178, 217,
218]
0.2–0.3 [185]
0.3–0.35 [219]
0.32–0.35
[220]
0.3 [221]
The numbers mean the mole fraction of the structure-forming metal in the alloy processed. Further
data on systems that are suitable for dealloying can be found in Ref. [172]
The latter is a degree of freedom that lends more versatility to the electrochemical
dealloying procedure as compared to the chemical ones, yielding an opportunity of
tuning the pore size. Figure 8.11 presents representative examples of the impact of
the dealloying conditions on the porous structure formed. If all other conditions are
identical, less positive dealloying potentials lead to smaller pore sizes [211] provided
that the process takes place in a single step. The above described pore size rule may
not be true if multistage dealloying takes place with some intermediate composition
that has exceptional stability, as it was found for Au–Cu alloys [212].
The shape of the electrical signal used for dealloying may vary. A potential sweep
instead of an abrupt potential change was found to lead to a crack-free porous structure
[220], which may be associated with the stress occurring during the atomic-scale
8 Porous Nanostructured Materials
Table 8.2 List of binary alloys applied in dealloying studies with inclination to nanopore formation
Dissolved
metal
Nanoporous structure-forming metal
Ni
Bi
Cu
Pd
Au
Pt
Mg
0.33–0.67
[191]
Al
0.6–0.7
[195]
0.25 [196]
0.2 [197]
Zr
0.8 [198]
0.62 [199]
Mn
0.38 [200]
0.3 [201, 202]
0.15–0.45
[192]
Zn
0.103 [203]
Sn
0.05–0.5
[193]
0.4 [204]
0.45 [205]
Co
0.2 [206]
Ni
0.82 [207]
0.25 [208]
Cu
0.5–0.86 [190]
0.2–0.8 [209]
0.25 [210]
0.15–0.25
[194]
0.18–0.23
[211]
0.2–0.3 [212]
0.18–0.48
[213]
0.25–0.75
[188]
0.2–0.29
[214]
0.78–0.82
[215]
0.25 [216]
Ag
0.35 [178, 217,
218]
0.2–0.3 [185]
0.3–0.35 [219]
0.32–0.35
[220]
0.3 [221]
The numbers mean the mole fraction of the structure-forming metal in the alloy processed. Further
data on systems that are suitable for dealloying can be found in Ref. [172]
The latter is a degree of freedom that lends more versatility to the electrochemical
dealloying procedure as compared to the chemical ones, yielding an opportunity of
tuning the pore size. Figure 8.11 presents representative examples of the impact of
the dealloying conditions on the porous structure formed. If all other conditions are
identical, less positive dealloying potentials lead to smaller pore sizes [211] provided
that the process takes place in a single step. The above described pore size rule may
not be true if multistage dealloying takes place with some intermediate composition
that has exceptional stability, as it was found for Au–Cu alloys [212].
The shape of the electrical signal used for dealloying may vary. A potential sweep
instead of an abrupt potential change was found to lead to a crack-free porous structure
[220], which may be associated with the stress occurring during the atomic-scale