

284
8 Porous Nanostructured Materials
D S =
[d(t)]
4 kT
32γ ta 4 .
(8.7)
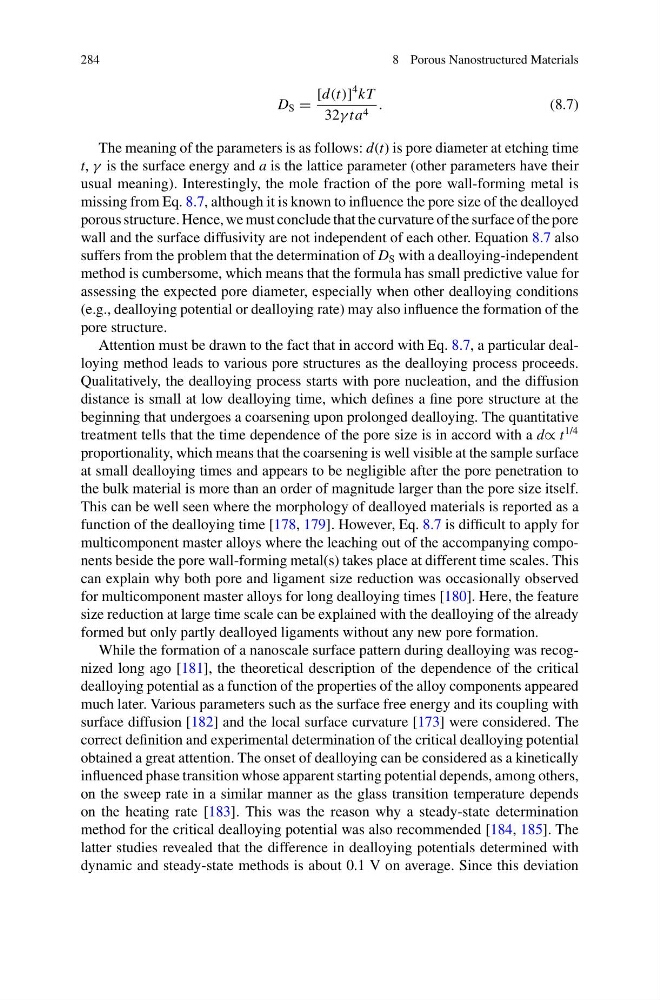
The meaning of the parameters is as follows: d(t) is pore diameter at etching time
t, γ is the surface energy and a is the lattice parameter (other parameters have their
usual meaning). Interestingly, the mole fraction of the pore wall-forming metal is
missing from Eq. 8.7, although it is known to influence the pore size of the dealloyed
porous structure. Hence, we must conclude that the curvature of the surface of the pore
wall and the surface diffusivity are not independent of each other. Equation 8.7 also
suffers from the problem that the determination of D S with a dealloying-independent
method is cumbersome, which means that the formula has small predictive value for
assessing the expected pore diameter, especially when other dealloying conditions
(e.g., dealloying potential or dealloying rate) may also influence the formation of the
pore structure.
Attention must be drawn to the fact that in accord with Eq. 8.7, a particular dealloying method leads to various pore structures as the dealloying process proceeds.
Qualitatively, the dealloying process starts with pore nucleation, and the diffusion
distance is small at low dealloying time, which defines a fine pore structure at the
beginning that undergoes a coarsening upon prolonged dealloying. The quantitative
treatment tells that the time dependence of the pore size is in accord with a d∝ t
1/4
proportionality, which means that the coarsening is well visible at the sample surface
at small dealloying times and appears to be negligible after the pore penetration to
the bulk material is more than an order of magnitude larger than the pore size itself.
This can be well seen where the morphology of dealloyed materials is reported as a
function of the dealloying time [178, 179]. However, Eq. 8.7 is difficult to apply for
multicomponent master alloys where the leaching out of the accompanying components beside the pore wall-forming metal(s) takes place at different time scales. This
can explain why both pore and ligament size reduction was occasionally observed
for multicomponent master alloys for long dealloying times [180]. Here, the feature
size reduction at large time scale can be explained with the dealloying of the already
formed but only partly dealloyed ligaments without any new pore formation.
While the formation of a nanoscale surface pattern during dealloying was recognized long ago [181], the theoretical description of the dependence of the critical
dealloying potential as a function of the properties of the alloy components appeared
much later. Various parameters such as the surface free energy and its coupling with
surface diffusion [182] and the local surface curvature [173] were considered. The
correct definition and experimental determination of the critical dealloying potential
obtained a great attention. The onset of dealloying can be considered as a kinetically
influenced phase transition whose apparent starting potential depends, among others,
on the sweep rate in a similar manner as the glass transition temperature depends
on the heating rate [183]. This was the reason why a steady-state determination
method for the critical dealloying potential was also recommended [184, 185]. The
latter studies revealed that the difference in dealloying potentials determined with
dynamic and steady-state methods is about 0.1 V on average. Since this deviation
8 Porous Nanostructured Materials
D S =
[d(t)]
4 kT
32γ ta 4 .
(8.7)
The meaning of the parameters is as follows: d(t) is pore diameter at etching time
t, γ is the surface energy and a is the lattice parameter (other parameters have their
usual meaning). Interestingly, the mole fraction of the pore wall-forming metal is
missing from Eq. 8.7, although it is known to influence the pore size of the dealloyed
porous structure. Hence, we must conclude that the curvature of the surface of the pore
wall and the surface diffusivity are not independent of each other. Equation 8.7 also
suffers from the problem that the determination of D S with a dealloying-independent
method is cumbersome, which means that the formula has small predictive value for
assessing the expected pore diameter, especially when other dealloying conditions
(e.g., dealloying potential or dealloying rate) may also influence the formation of the
pore structure.
Attention must be drawn to the fact that in accord with Eq. 8.7, a particular dealloying method leads to various pore structures as the dealloying process proceeds.
Qualitatively, the dealloying process starts with pore nucleation, and the diffusion
distance is small at low dealloying time, which defines a fine pore structure at the
beginning that undergoes a coarsening upon prolonged dealloying. The quantitative
treatment tells that the time dependence of the pore size is in accord with a d∝ t
1/4
proportionality, which means that the coarsening is well visible at the sample surface
at small dealloying times and appears to be negligible after the pore penetration to
the bulk material is more than an order of magnitude larger than the pore size itself.
This can be well seen where the morphology of dealloyed materials is reported as a
function of the dealloying time [178, 179]. However, Eq. 8.7 is difficult to apply for
multicomponent master alloys where the leaching out of the accompanying components beside the pore wall-forming metal(s) takes place at different time scales. This
can explain why both pore and ligament size reduction was occasionally observed
for multicomponent master alloys for long dealloying times [180]. Here, the feature
size reduction at large time scale can be explained with the dealloying of the already
formed but only partly dealloyed ligaments without any new pore formation.
While the formation of a nanoscale surface pattern during dealloying was recognized long ago [181], the theoretical description of the dependence of the critical
dealloying potential as a function of the properties of the alloy components appeared
much later. Various parameters such as the surface free energy and its coupling with
surface diffusion [182] and the local surface curvature [173] were considered. The
correct definition and experimental determination of the critical dealloying potential
obtained a great attention. The onset of dealloying can be considered as a kinetically
influenced phase transition whose apparent starting potential depends, among others,
on the sweep rate in a similar manner as the glass transition temperature depends
on the heating rate [183]. This was the reason why a steady-state determination
method for the critical dealloying potential was also recommended [184, 185]. The
latter studies revealed that the difference in dealloying potentials determined with
dynamic and steady-state methods is about 0.1 V on average. Since this deviation