

6.3 Electrodeposited Nanocrystalline Alloys
209
be suitable to deposit Ni–P and Co–P coatings, the above choice of the precursor
compounds offer a better bath stability. For boron inclusion, trimethylamine borane
[229] can be used similarly to the baths developed for Ni–B amorphous alloys,
but borohydride type compounds like Na 2 B 10 H 10 also proved to be feasible [230].
Unlike (Ni,Co)–(P,B) alloys that can be produced in an either an amorphous or
in nanocrystalline state by melt quenching (at either sufficiently high or moderate
quenching rate, respectively), alloys with carbon as the single metalloid elements
are not available with this method. However, electroplating offers an opportunity to
obtain nanocrystalline or even amorphous Fe–C [231] and Cr–C [232–234] alloys
where the carbon content comes from various organic additives of the bath (e.g.,
formic acid and citric acid for Cr and Fe, respectively.)
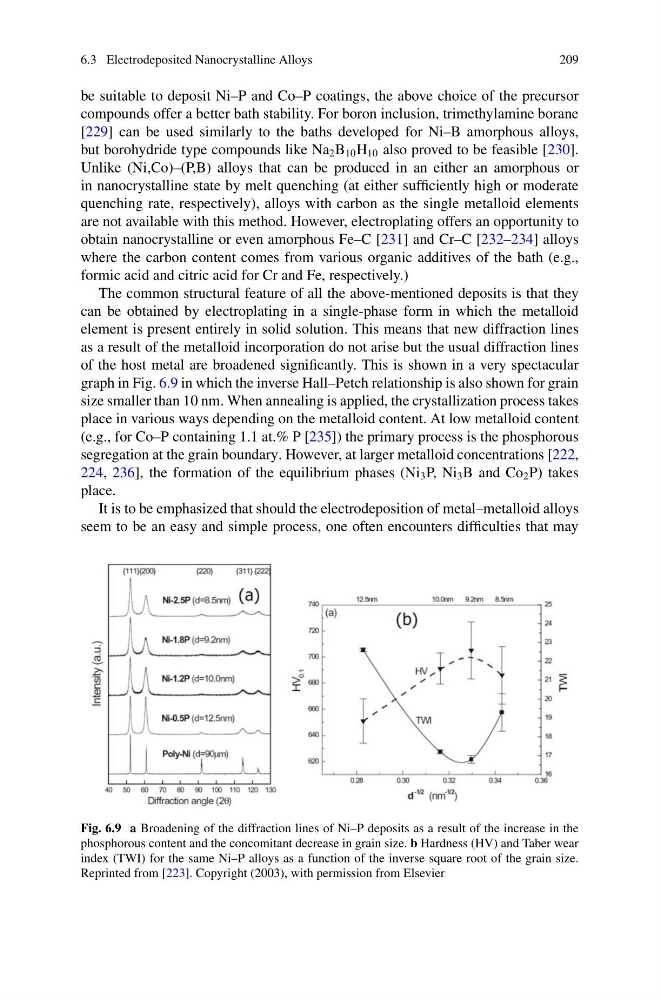
The common structural feature of all the above-mentioned deposits is that they
can be obtained by electroplating in a single-phase form in which the metalloid
element is present entirely in solid solution. This means that new diffraction lines
as a result of the metalloid incorporation do not arise but the usual diffraction lines
of the host metal are broadened significantly. This is shown in a very spectacular
graph in Fig. 6.9 in which the inverse Hall–Petch relationship is also shown for grain
size smaller than 10 nm. When annealing is applied, the crystallization process takes
place in various ways depending on the metalloid content. At low metalloid content
(e.g., for Co–P containing 1.1 at.% P [235]) the primary process is the phosphorous
segregation at the grain boundary. However, at larger metalloid concentrations [222,
224, 236], the formation of the equilibrium phases (Ni 3 P, Ni 3 B and Co 2 P) takes
place.
It is to be emphasized that should the electrodeposition of metal–metalloid alloys
seem to be an easy and simple process, one often encounters difficulties that may
Fig. 6.9 a Broadening of the diffraction lines of Ni–P deposits as a result of the increase in the
phosphorous content and the concomitant decrease in grain size. b Hardness (HV) and Taber wear
index (TWI) for the same Ni–P alloys as a function of the inverse square root of the grain size.
Reprinted from [223]. Copyright (2003), with permission from Elsevier
209
be suitable to deposit Ni–P and Co–P coatings, the above choice of the precursor
compounds offer a better bath stability. For boron inclusion, trimethylamine borane
[229] can be used similarly to the baths developed for Ni–B amorphous alloys,
but borohydride type compounds like Na 2 B 10 H 10 also proved to be feasible [230].
Unlike (Ni,Co)–(P,B) alloys that can be produced in an either an amorphous or
in nanocrystalline state by melt quenching (at either sufficiently high or moderate
quenching rate, respectively), alloys with carbon as the single metalloid elements
are not available with this method. However, electroplating offers an opportunity to
obtain nanocrystalline or even amorphous Fe–C [231] and Cr–C [232–234] alloys
where the carbon content comes from various organic additives of the bath (e.g.,
formic acid and citric acid for Cr and Fe, respectively.)
The common structural feature of all the above-mentioned deposits is that they
can be obtained by electroplating in a single-phase form in which the metalloid
element is present entirely in solid solution. This means that new diffraction lines
as a result of the metalloid incorporation do not arise but the usual diffraction lines
of the host metal are broadened significantly. This is shown in a very spectacular
graph in Fig. 6.9 in which the inverse Hall–Petch relationship is also shown for grain
size smaller than 10 nm. When annealing is applied, the crystallization process takes
place in various ways depending on the metalloid content. At low metalloid content
(e.g., for Co–P containing 1.1 at.% P [235]) the primary process is the phosphorous
segregation at the grain boundary. However, at larger metalloid concentrations [222,
224, 236], the formation of the equilibrium phases (Ni 3 P, Ni 3 B and Co 2 P) takes
place.
It is to be emphasized that should the electrodeposition of metal–metalloid alloys
seem to be an easy and simple process, one often encounters difficulties that may
Fig. 6.9 a Broadening of the diffraction lines of Ni–P deposits as a result of the increase in the
phosphorous content and the concomitant decrease in grain size. b Hardness (HV) and Taber wear
index (TWI) for the same Ni–P alloys as a function of the inverse square root of the grain size.
Reprinted from [223]. Copyright (2003), with permission from Elsevier