

Crack Assessment Based on the Use of Severity-Adjusted …
503
0
0.005
0.01
0.015
0.02
0.025
0.0 0.1 0.2 0.3 0.4 0.5 0.6 0.7 0.8 0.9 1.0
Severity [-]
Normalized distance (x/L)
Mode 1
Mode 2
Mode 3
Mode 4
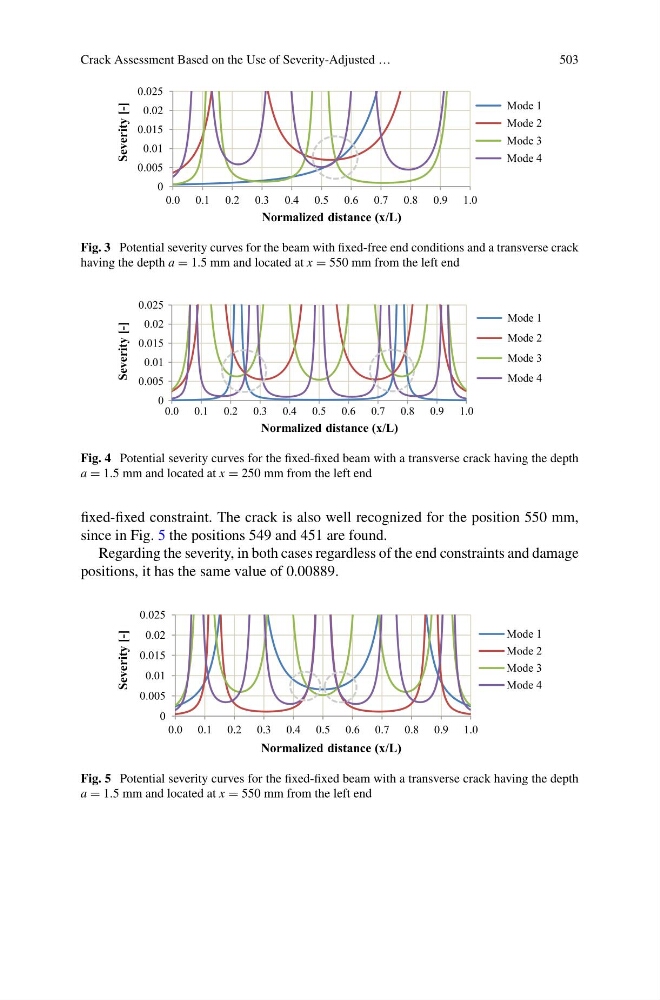
Fig. 3 Potential severity curves for the beam with fixed-free end conditions and a transverse crack
having the depth a = 1.5 mm and located at x = 550 mm from the left end
0
0.005
0.01
0.015
0.02
0.025
0.0 0.1 0.2 0.3 0.4 0.5 0.6 0.7 0.8 0.9 1.0
Severity [-]
Normalized distance (x/L)
Mode 1
Mode 2
Mode 3
Mode 4
Fig. 4 Potential severity curves for the fixed-fixed beam with a transverse crack having the depth
a = 1.5 mm and located at x = 250 mm from the left end
fixed-fixed constraint. The crack is also well recognized for the position 550 mm,
since in Fig. 5 the positions 549 and 451 are found.
Regarding the severity, in both cases regardless of the end constraints and damage
positions, it has the same value of 0.00889.
0
0.005
0.01
0.015
0.02
0.025
0.0 0.1 0.2 0.3 0.4 0.5 0.6 0.7 0.8 0.9 1.0
Severity [-]
Normalized distance (x/L)
Mode 1
Mode 2
Mode 3
Mode 4
Fig. 5 Potential severity curves for the fixed-fixed beam with a transverse crack having the depth
a = 1.5 mm and located at x = 550 mm from the left end
503
0
0.005
0.01
0.015
0.02
0.025
0.0 0.1 0.2 0.3 0.4 0.5 0.6 0.7 0.8 0.9 1.0
Severity [-]
Normalized distance (x/L)
Mode 1
Mode 2
Mode 3
Mode 4
Fig. 3 Potential severity curves for the beam with fixed-free end conditions and a transverse crack
having the depth a = 1.5 mm and located at x = 550 mm from the left end
0
0.005
0.01
0.015
0.02
0.025
0.0 0.1 0.2 0.3 0.4 0.5 0.6 0.7 0.8 0.9 1.0
Severity [-]
Normalized distance (x/L)
Mode 1
Mode 2
Mode 3
Mode 4
Fig. 4 Potential severity curves for the fixed-fixed beam with a transverse crack having the depth
a = 1.5 mm and located at x = 250 mm from the left end
fixed-fixed constraint. The crack is also well recognized for the position 550 mm,
since in Fig. 5 the positions 549 and 451 are found.
Regarding the severity, in both cases regardless of the end constraints and damage
positions, it has the same value of 0.00889.
0
0.005
0.01
0.015
0.02
0.025
0.0 0.1 0.2 0.3 0.4 0.5 0.6 0.7 0.8 0.9 1.0
Severity [-]
Normalized distance (x/L)
Mode 1
Mode 2
Mode 3
Mode 4
Fig. 5 Potential severity curves for the fixed-fixed beam with a transverse crack having the depth
a = 1.5 mm and located at x = 550 mm from the left end