

502
G.-R. Gillich et al.
Table 1 Beams’ main dimensions and material properties
Length
L (mm)
Width
B (mm)
Thickness
H (mm)
Mass density
ρ (kg/mm 3 )
Young’s modulus
E (N/m 2 )
Poisson ratio
v (-)
1000
50
5
7850
2 × 10 11
0.3
the CAD software SolidWorks with its main dimensions and material properties
presented in Table 1.
The modal analysis was performed by means of the ANSYS professional software, by defining the imposed end constraints and a fine hexahedral mesh with the
maximum edge of 2 mm.
We have considered for this study transversal breathing cracks of 1.5 mm depth.
The cracks are located at distance x = 250 mm from the left beam end in the first
case, respectively, and x = 550 mm in the second case.
3 Results and Discussion
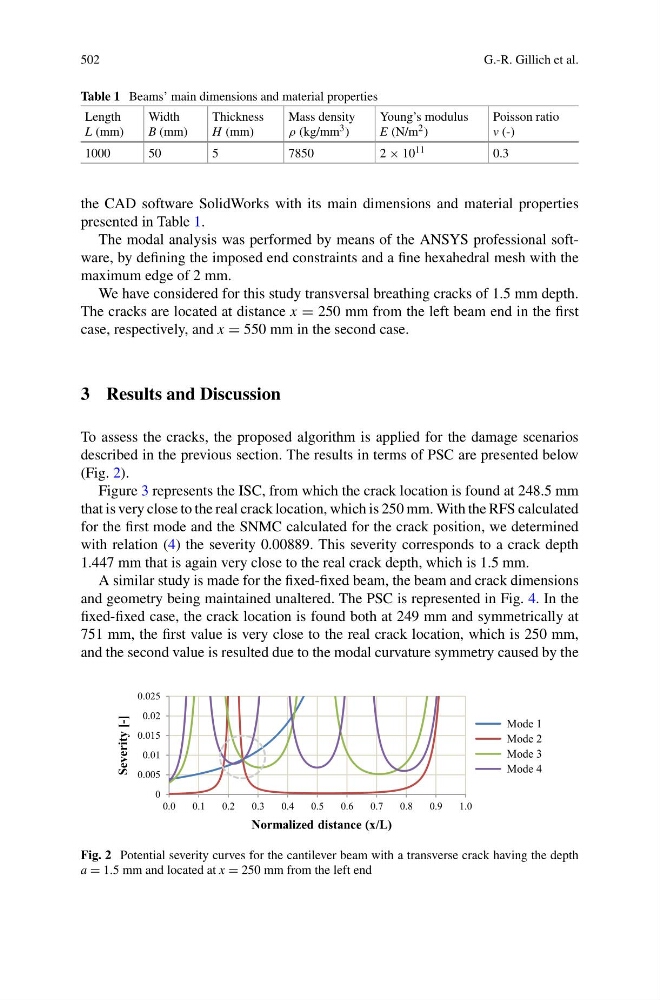
To assess the cracks, the proposed algorithm is applied for the damage scenarios
described in the previous section. The results in terms of PSC are presented below
(Fig. 2).
Figure 3 represents the ISC, from which the crack location is found at 248.5 mm
that is very close to the real crack location, which is 250 mm. With the RFS calculated
for the first mode and the SNMC calculated for the crack position, we determined
with relation (4) the severity 0.00889. This severity corresponds to a crack depth
1.447 mm that is again very close to the real crack depth, which is 1.5 mm.
A similar study is made for the fixed-fixed beam, the beam and crack dimensions
and geometry being maintained unaltered. The PSC is represented in Fig. 4. In the
fixed-fixed case, the crack location is found both at 249 mm and symmetrically at
751 mm, the first value is very close to the real crack location, which is 250 mm,
and the second value is resulted due to the modal curvature symmetry caused by the
0
0.005
0.01
0.015
0.02
0.025
0.0
0.1
0.2
0.3
0.4
0.5
0.6
0.7
0.8
0.9
1.0
Severity [-]
Normalized distance (x/L)
Mode 1
Mode 2
Mode 3
Mode 4
Fig. 2 Potential severity curves for the cantilever beam with a transverse crack having the depth
a = 1.5 mm and located at x = 250 mm from the left end
G.-R. Gillich et al.
Table 1 Beams’ main dimensions and material properties
Length
L (mm)
Width
B (mm)
Thickness
H (mm)
Mass density
ρ (kg/mm 3 )
Young’s modulus
E (N/m 2 )
Poisson ratio
v (-)
1000
50
5
7850
2 × 10 11
0.3
the CAD software SolidWorks with its main dimensions and material properties
presented in Table 1.
The modal analysis was performed by means of the ANSYS professional software, by defining the imposed end constraints and a fine hexahedral mesh with the
maximum edge of 2 mm.
We have considered for this study transversal breathing cracks of 1.5 mm depth.
The cracks are located at distance x = 250 mm from the left beam end in the first
case, respectively, and x = 550 mm in the second case.
3 Results and Discussion
To assess the cracks, the proposed algorithm is applied for the damage scenarios
described in the previous section. The results in terms of PSC are presented below
(Fig. 2).
Figure 3 represents the ISC, from which the crack location is found at 248.5 mm
that is very close to the real crack location, which is 250 mm. With the RFS calculated
for the first mode and the SNMC calculated for the crack position, we determined
with relation (4) the severity 0.00889. This severity corresponds to a crack depth
1.447 mm that is again very close to the real crack depth, which is 1.5 mm.
A similar study is made for the fixed-fixed beam, the beam and crack dimensions
and geometry being maintained unaltered. The PSC is represented in Fig. 4. In the
fixed-fixed case, the crack location is found both at 249 mm and symmetrically at
751 mm, the first value is very close to the real crack location, which is 250 mm,
and the second value is resulted due to the modal curvature symmetry caused by the
0
0.005
0.01
0.015
0.02
0.025
0.0
0.1
0.2
0.3
0.4
0.5
0.6
0.7
0.8
0.9
1.0
Severity [-]
Normalized distance (x/L)
Mode 1
Mode 2
Mode 3
Mode 4
Fig. 2 Potential severity curves for the cantilever beam with a transverse crack having the depth
a = 1.5 mm and located at x = 250 mm from the left end