

494
P. Szuchy
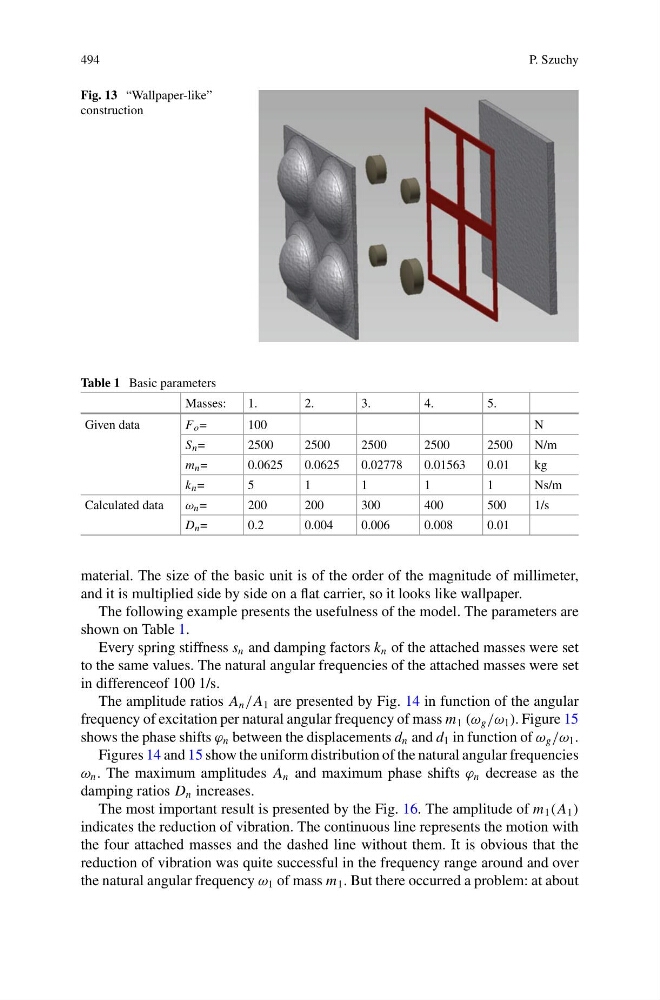
Fig. 13 “Wallpaper-like”
construction
Table 1 Basic parameters
Masses:
1.
2.
3.
4.
5.
Given data
F o =
100
N
S n =
2500
2500
2500
2500
2500
N/m
m n =
0.0625
0.0625
0.02778
0.01563
0.01
kg
k n =
5
1
1
1
1
Ns/m
Calculated data
ω n =
200
200
300
400
500
1/s
D n =
0.2
0.004
0.006
0.008
0.01
material. The size of the basic unit is of the order of the magnitude of millimeter,
and it is multiplied side by side on a flat carrier, so it looks like wallpaper.
The following example presents the usefulness of the model. The parameters are
shown on Table 1.
Every spring stiffness s n and damping factors k n of the attached masses were set
to the same values. The natural angular frequencies of the attached masses were set
in differenceof 100 1/s.
The amplitude ratios A n /A 1 are presented by Fig. 14 in function of the angular
frequency of excitation per natural angular frequency of mass m 1 (ω g /ω 1 ). Figure 15
shows the phase shifts ϕ n between the displacements d n and d 1 in function of ω g /ω 1 .
Figures 14 and 15 show the uniform distribution of the natural angular frequencies
ω n . The maximum amplitudes A n and maximum phase shifts ϕ n decrease as the
damping ratios D n increases.
The most important result is presented by the Fig. 16. The amplitude of m 1 (A 1 )
indicates the reduction of vibration. The continuous line represents the motion with
the four attached masses and the dashed line without them. It is obvious that the
reduction of vibration was quite successful in the frequency range around and over
the natural angular frequency ω 1 of mass m 1 . But there occurred a problem: at about
P. Szuchy
Fig. 13 “Wallpaper-like”
construction
Table 1 Basic parameters
Masses:
1.
2.
3.
4.
5.
Given data
F o =
100
N
S n =
2500
2500
2500
2500
2500
N/m
m n =
0.0625
0.0625
0.02778
0.01563
0.01
kg
k n =
5
1
1
1
1
Ns/m
Calculated data
ω n =
200
200
300
400
500
1/s
D n =
0.2
0.004
0.006
0.008
0.01
material. The size of the basic unit is of the order of the magnitude of millimeter,
and it is multiplied side by side on a flat carrier, so it looks like wallpaper.
The following example presents the usefulness of the model. The parameters are
shown on Table 1.
Every spring stiffness s n and damping factors k n of the attached masses were set
to the same values. The natural angular frequencies of the attached masses were set
in differenceof 100 1/s.
The amplitude ratios A n /A 1 are presented by Fig. 14 in function of the angular
frequency of excitation per natural angular frequency of mass m 1 (ω g /ω 1 ). Figure 15
shows the phase shifts ϕ n between the displacements d n and d 1 in function of ω g /ω 1 .
Figures 14 and 15 show the uniform distribution of the natural angular frequencies
ω n . The maximum amplitudes A n and maximum phase shifts ϕ n decrease as the
damping ratios D n increases.
The most important result is presented by the Fig. 16. The amplitude of m 1 (A 1 )
indicates the reduction of vibration. The continuous line represents the motion with
the four attached masses and the dashed line without them. It is obvious that the
reduction of vibration was quite successful in the frequency range around and over
the natural angular frequency ω 1 of mass m 1 . But there occurred a problem: at about