

Vibroacoustic Diagnostics …
421
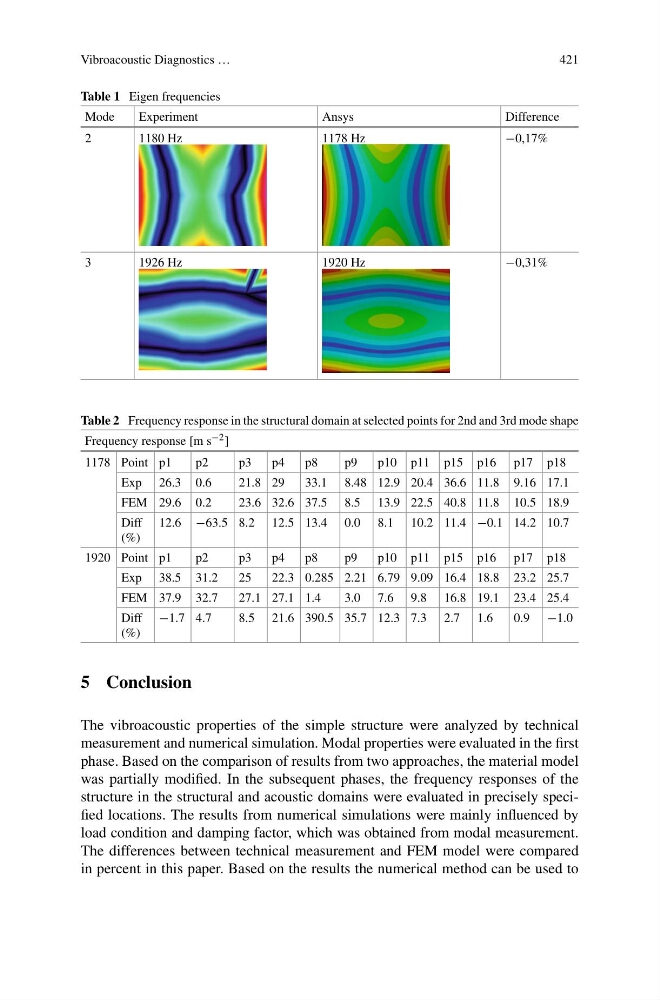
Table 1 Eigen frequencies
Mode
Experiment
Ansys
Difference
2
1180 Hz
1178 Hz
−0,17%
3
1926 Hz
1920 Hz
−0,31%
Table 2 Frequency response in the structural domain at selected points for 2nd and 3rd mode shape
Frequency response [m s −2 ]
1178 Point p1
p2
p3
p4
p8
p9
p10 p11 p15 p16 p17 p18
Exp 26.3 0.6
21.8 29
33.1 8.48 12.9 20.4 36.6 11.8 9.16 17.1
FEM 29.6 0.2
23.6 32.6 37.5 8.5 13.9 22.5 40.8 11.8 10.5 18.9
Diff
(%)
12.6 −63.5 8.2 12.5 13.4 0.0 8.1 10.2 11.4 −0.1 14.2 10.7
1920 Point p1
p2
p3
p4
p8
p9
p10 p11 p15 p16 p17 p18
Exp 38.5 31.2
25
22.3 0.285 2.21 6.79 9.09 16.4 18.8 23.2 25.7
FEM 37.9 32.7
27.1 27.1 1.4
3.0 7.6 9.8 16.8 19.1 23.4 25.4
Diff
(%)
−1.7 4.7
8.5 21.6 390.5 35.7 12.3 7.3 2.7 1.6
0.9 −1.0
5 Conclusion
The vibroacoustic properties of the simple structure were analyzed by technical
measurement and numerical simulation. Modal properties were evaluated in the first
phase. Based on the comparison of results from two approaches, the material model
was partially modified. In the subsequent phases, the frequency responses of the
structure in the structural and acoustic domains were evaluated in precisely specified locations. The results from numerical simulations were mainly influenced by
load condition and damping factor, which was obtained from modal measurement.
The differences between technical measurement and FEM model were compared
in percent in this paper. Based on the results the numerical method can be used to
421
Table 1 Eigen frequencies
Mode
Experiment
Ansys
Difference
2
1180 Hz
1178 Hz
−0,17%
3
1926 Hz
1920 Hz
−0,31%
Table 2 Frequency response in the structural domain at selected points for 2nd and 3rd mode shape
Frequency response [m s −2 ]
1178 Point p1
p2
p3
p4
p8
p9
p10 p11 p15 p16 p17 p18
Exp 26.3 0.6
21.8 29
33.1 8.48 12.9 20.4 36.6 11.8 9.16 17.1
FEM 29.6 0.2
23.6 32.6 37.5 8.5 13.9 22.5 40.8 11.8 10.5 18.9
Diff
(%)
12.6 −63.5 8.2 12.5 13.4 0.0 8.1 10.2 11.4 −0.1 14.2 10.7
1920 Point p1
p2
p3
p4
p8
p9
p10 p11 p15 p16 p17 p18
Exp 38.5 31.2
25
22.3 0.285 2.21 6.79 9.09 16.4 18.8 23.2 25.7
FEM 37.9 32.7
27.1 27.1 1.4
3.0 7.6 9.8 16.8 19.1 23.4 25.4
Diff
(%)
−1.7 4.7
8.5 21.6 390.5 35.7 12.3 7.3 2.7 1.6
0.9 −1.0
5 Conclusion
The vibroacoustic properties of the simple structure were analyzed by technical
measurement and numerical simulation. Modal properties were evaluated in the first
phase. Based on the comparison of results from two approaches, the material model
was partially modified. In the subsequent phases, the frequency responses of the
structure in the structural and acoustic domains were evaluated in precisely specified locations. The results from numerical simulations were mainly influenced by
load condition and damping factor, which was obtained from modal measurement.
The differences between technical measurement and FEM model were compared
in percent in this paper. Based on the results the numerical method can be used to