

420
R. Zajac et al.
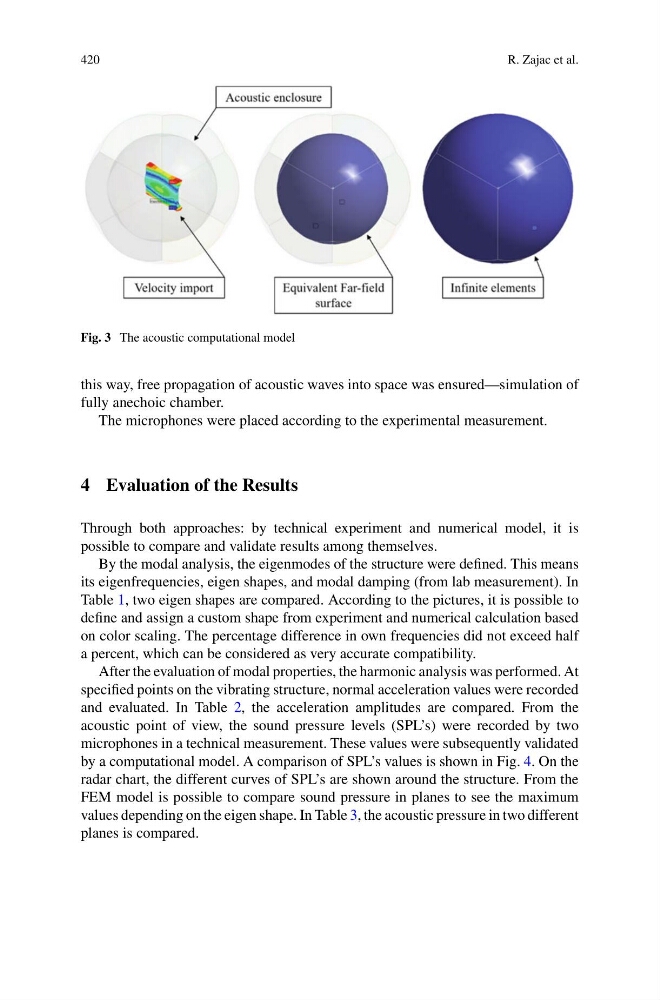
Fig. 3 The acoustic computational model
this way, free propagation of acoustic waves into space was ensured—simulation of
fully anechoic chamber.
The microphones were placed according to the experimental measurement.
4 Evaluation of the Results
Through both approaches: by technical experiment and numerical model, it is
possible to compare and validate results among themselves.
By the modal analysis, the eigenmodes of the structure were defined. This means
its eigenfrequencies, eigen shapes, and modal damping (from lab measurement). In
Table 1, two eigen shapes are compared. According to the pictures, it is possible to
define and assign a custom shape from experiment and numerical calculation based
on color scaling. The percentage difference in own frequencies did not exceed half
a percent, which can be considered as very accurate compatibility.
After the evaluation of modal properties, the harmonic analysis was performed. At
specified points on the vibrating structure, normal acceleration values were recorded
and evaluated. In Table 2, the acceleration amplitudes are compared. From the
acoustic point of view, the sound pressure levels (SPL’s) were recorded by two
microphones in a technical measurement. These values were subsequently validated
by a computational model. A comparison of SPL’s values is shown in Fig. 4. On the
radar chart, the different curves of SPL’s are shown around the structure. From the
FEM model is possible to compare sound pressure in planes to see the maximum
values depending on the eigen shape. In Table 3, the acoustic pressure in two different
planes is compared.
R. Zajac et al.
Fig. 3 The acoustic computational model
this way, free propagation of acoustic waves into space was ensured—simulation of
fully anechoic chamber.
The microphones were placed according to the experimental measurement.
4 Evaluation of the Results
Through both approaches: by technical experiment and numerical model, it is
possible to compare and validate results among themselves.
By the modal analysis, the eigenmodes of the structure were defined. This means
its eigenfrequencies, eigen shapes, and modal damping (from lab measurement). In
Table 1, two eigen shapes are compared. According to the pictures, it is possible to
define and assign a custom shape from experiment and numerical calculation based
on color scaling. The percentage difference in own frequencies did not exceed half
a percent, which can be considered as very accurate compatibility.
After the evaluation of modal properties, the harmonic analysis was performed. At
specified points on the vibrating structure, normal acceleration values were recorded
and evaluated. In Table 2, the acceleration amplitudes are compared. From the
acoustic point of view, the sound pressure levels (SPL’s) were recorded by two
microphones in a technical measurement. These values were subsequently validated
by a computational model. A comparison of SPL’s values is shown in Fig. 4. On the
radar chart, the different curves of SPL’s are shown around the structure. From the
FEM model is possible to compare sound pressure in planes to see the maximum
values depending on the eigen shape. In Table 3, the acoustic pressure in two different
planes is compared.