

406
R. Nagy et al.
Data collected from accelerometers were done at 10, 20, 30, and 40 bar using
single-stage compression and dual-stage compression. Because the actuator was an
electric motor of 3000 rpm 0.6 kW, the recorded interval was of 250 ms considering
the repetitive nature of the electric motor. The sampling frequency of the acquisition
system was set to 4096 Hz for an in-depth analysis [5].
The compressor was fixed to a rigid chassis without rubber dampers, and measurements were repeated 3 times in order to validate the repeatability of the measured
data, through ulterior comparison of the average root mean square acceleration (a rms ).
Due to the direct nature of the measurement system, the error from the human factor
was excluded.
4 Vibration Analysis
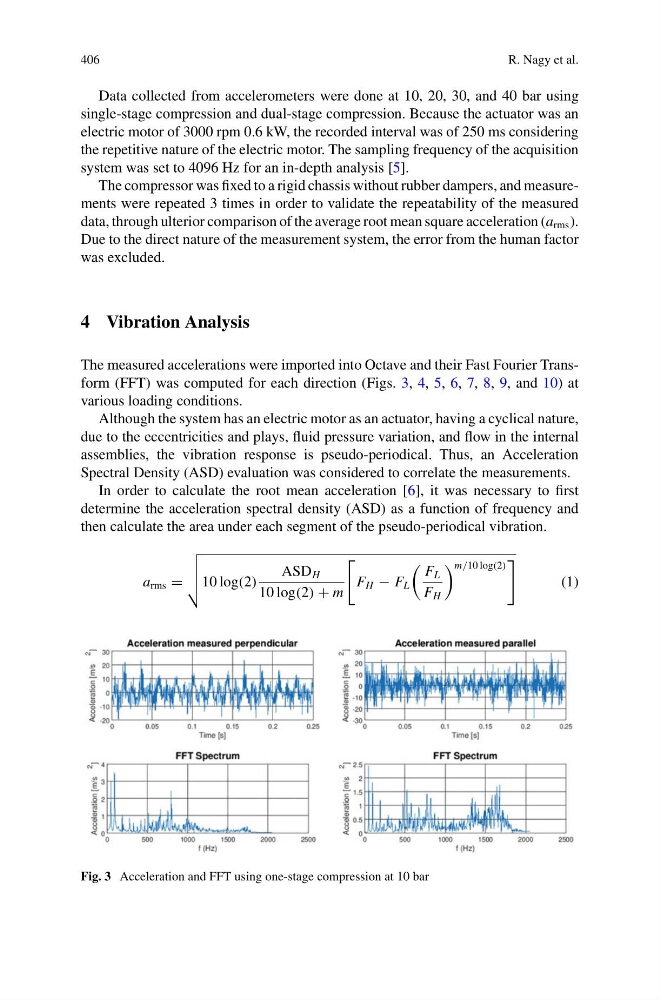
The measured accelerations were imported into Octave and their Fast Fourier Transform (FFT) was computed for each direction (Figs. 3, 4, 5, 6, 7, 8, 9, and 10) at
various loading conditions.
Although the system has an electric motor as an actuator, having a cyclical nature,
due to the eccentricities and plays, fluid pressure variation, and flow in the internal
assemblies, the vibration response is pseudo-periodical. Thus, an Acceleration
Spectral Density (ASD) evaluation was considered to correlate the measurements.
In order to calculate the root mean acceleration [6], it was necessary to first
determine the acceleration spectral density (ASD) as a function of frequency and
then calculate the area under each segment of the pseudo-periodical vibration.
a rms =
10 log(2)
ASD H
10 log(2) + m
F H − F L
F L
F H
m/10 log(2)
(1)
Fig. 3 Acceleration and FFT using one-stage compression at 10 bar
R. Nagy et al.
Data collected from accelerometers were done at 10, 20, 30, and 40 bar using
single-stage compression and dual-stage compression. Because the actuator was an
electric motor of 3000 rpm 0.6 kW, the recorded interval was of 250 ms considering
the repetitive nature of the electric motor. The sampling frequency of the acquisition
system was set to 4096 Hz for an in-depth analysis [5].
The compressor was fixed to a rigid chassis without rubber dampers, and measurements were repeated 3 times in order to validate the repeatability of the measured
data, through ulterior comparison of the average root mean square acceleration (a rms ).
Due to the direct nature of the measurement system, the error from the human factor
was excluded.
4 Vibration Analysis
The measured accelerations were imported into Octave and their Fast Fourier Transform (FFT) was computed for each direction (Figs. 3, 4, 5, 6, 7, 8, 9, and 10) at
various loading conditions.
Although the system has an electric motor as an actuator, having a cyclical nature,
due to the eccentricities and plays, fluid pressure variation, and flow in the internal
assemblies, the vibration response is pseudo-periodical. Thus, an Acceleration
Spectral Density (ASD) evaluation was considered to correlate the measurements.
In order to calculate the root mean acceleration [6], it was necessary to first
determine the acceleration spectral density (ASD) as a function of frequency and
then calculate the area under each segment of the pseudo-periodical vibration.
a rms =
10 log(2)
ASD H
10 log(2) + m
F H − F L
F L
F H
m/10 log(2)
(1)
Fig. 3 Acceleration and FFT using one-stage compression at 10 bar