

326
D. I. Stoia et al.
The mechanical testing runs on a tensile testing machine, setting up the displacement velocity to 5 mm/min. The tests were all conducted to the breaking point.
The force displacement diagrams were then used to extract the maximum force
and to compute the corresponding stress value, taking into consideration the real
cross-sectional area of samples.
2.3 Taguchi Design
The main goal in Taguchi design is to improve the quality of the products by determining which individual factor has more or less influence in the process results.
According to Taguchi’s approach based on control factors, L9 is an appropriate
orthogonal array that reduces the number of experiments from 27 to 9 (Table 2)
saving the time and costs and producing accurate results.
Because the goal parameter is the tensile strength and this should be as high
as possible, the maximization criterion was used. In larger is better approach, the
signal-to-noise ratio is computed using (1) [14], where x i represents the mechanical
strength.
SN = −10 × log 10
1
n
·
n
i=1
1
x
2
i
(1)
3 Results and Discussions
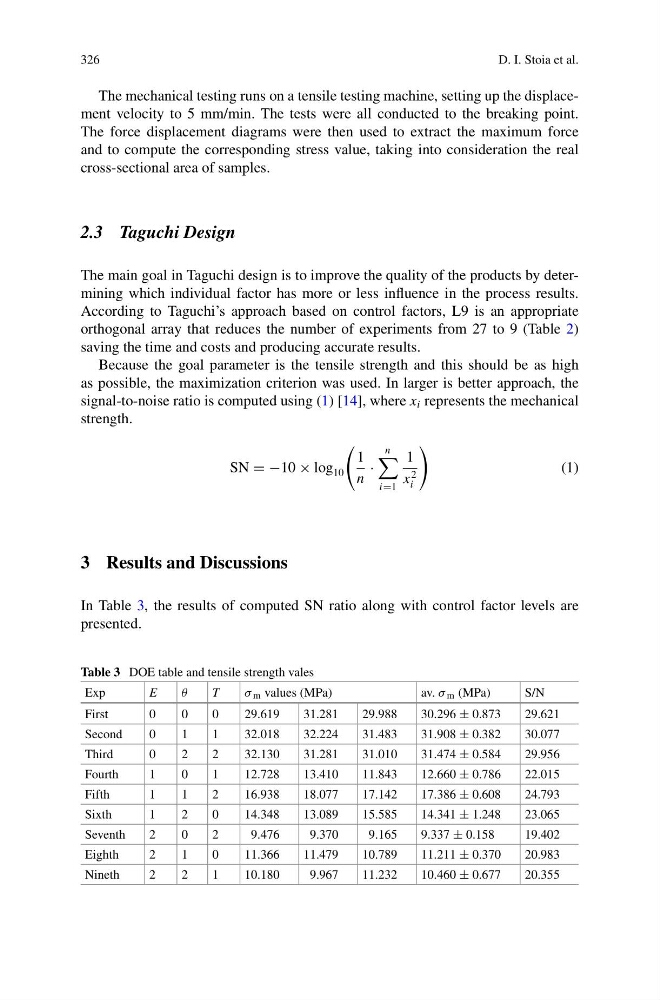
In Table 3, the results of computed SN ratio along with control factor levels are
presented.
Table 3 DOE table and tensile strength vales
Exp
E
θ
T
σ m values (MPa)
av. σ m (MPa)
S/N
First
0
0
0
29.619
31.281
29.988
30.296 ± 0.873
29.621
Second
0
1
1
32.018
32.224
31.483
31.908 ± 0.382
30.077
Third
0
2
2
32.130
31.281
31.010
31.474 ± 0.584
29.956
Fourth
1
0
1
12.728
13.410
11.843
12.660 ± 0.786
22.015
Fifth
1
1
2
16.938
18.077
17.142
17.386 ± 0.608
24.793
Sixth
1
2
0
14.348
13.089
15.585
14.341 ± 1.248
23.065
Seventh
2
0
2
9.476
9.370
9.165
9.337 ± 0.158
19.402
Eighth
2
1
0
11.366
11.479
10.789
11.211 ± 0.370
20.983
Nineth
2
2
1
10.180
9.967
11.232
10.460 ± 0.677
20.355
D. I. Stoia et al.
The mechanical testing runs on a tensile testing machine, setting up the displacement velocity to 5 mm/min. The tests were all conducted to the breaking point.
The force displacement diagrams were then used to extract the maximum force
and to compute the corresponding stress value, taking into consideration the real
cross-sectional area of samples.
2.3 Taguchi Design
The main goal in Taguchi design is to improve the quality of the products by determining which individual factor has more or less influence in the process results.
According to Taguchi’s approach based on control factors, L9 is an appropriate
orthogonal array that reduces the number of experiments from 27 to 9 (Table 2)
saving the time and costs and producing accurate results.
Because the goal parameter is the tensile strength and this should be as high
as possible, the maximization criterion was used. In larger is better approach, the
signal-to-noise ratio is computed using (1) [14], where x i represents the mechanical
strength.
SN = −10 × log 10
1
n
·
n
i=1
1
x
2
i
(1)
3 Results and Discussions
In Table 3, the results of computed SN ratio along with control factor levels are
presented.
Table 3 DOE table and tensile strength vales
Exp
E
θ
T
σ m values (MPa)
av. σ m (MPa)
S/N
First
0
0
0
29.619
31.281
29.988
30.296 ± 0.873
29.621
Second
0
1
1
32.018
32.224
31.483
31.908 ± 0.382
30.077
Third
0
2
2
32.130
31.281
31.010
31.474 ± 0.584
29.956
Fourth
1
0
1
12.728
13.410
11.843
12.660 ± 0.786
22.015
Fifth
1
1
2
16.938
18.077
17.142
17.386 ± 0.608
24.793
Sixth
1
2
0
14.348
13.089
15.585
14.341 ± 1.248
23.065
Seventh
2
0
2
9.476
9.370
9.165
9.337 ± 0.158
19.402
Eighth
2
1
0
11.366
11.479
10.789
11.211 ± 0.370
20.983
Nineth
2
2
1
10.180
9.967
11.232
10.460 ± 0.677
20.355