

Designing and Creating a Smart Audiometer Using …
285
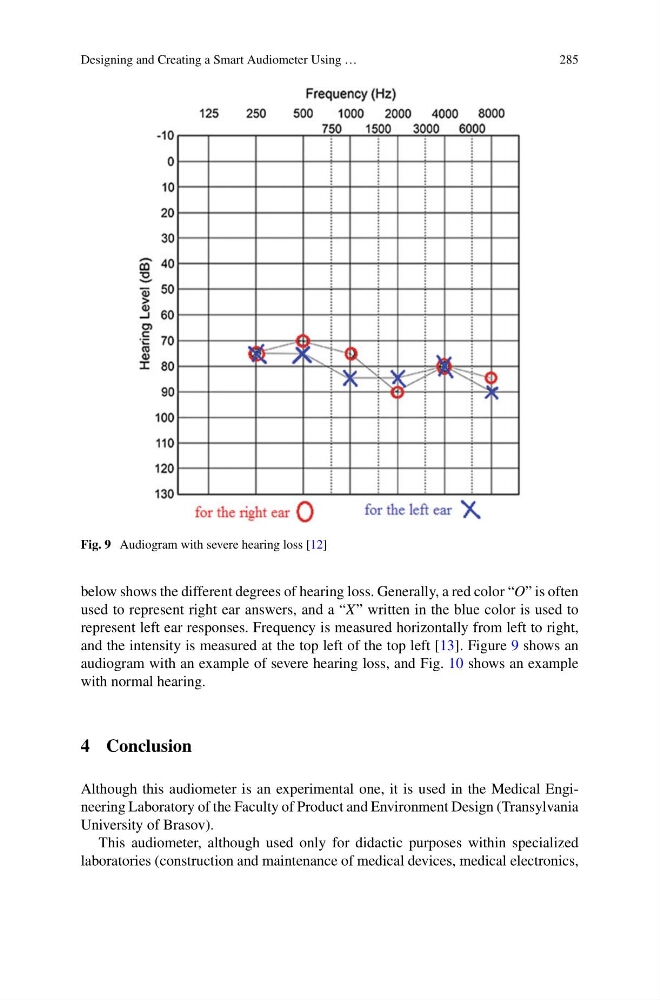
Fig. 9 Audiogram with severe hearing loss [12]
below shows the different degrees of hearing loss. Generally, a red color “O” is often
used to represent right ear answers, and a “X” written in the blue color is used to
represent left ear responses. Frequency is measured horizontally from left to right,
and the intensity is measured at the top left of the top left [13]. Figure 9 shows an
audiogram with an example of severe hearing loss, and Fig. 10 shows an example
with normal hearing.
4 Conclusion
Although this audiometer is an experimental one, it is used in the Medical Engineering Laboratory of the Faculty of Product and Environment Design (Transylvania
University of Brasov).
This audiometer, although used only for didactic purposes within specialized
laboratories (construction and maintenance of medical devices, medical electronics,
285
Fig. 9 Audiogram with severe hearing loss [12]
below shows the different degrees of hearing loss. Generally, a red color “O” is often
used to represent right ear answers, and a “X” written in the blue color is used to
represent left ear responses. Frequency is measured horizontally from left to right,
and the intensity is measured at the top left of the top left [13]. Figure 9 shows an
audiogram with an example of severe hearing loss, and Fig. 10 shows an example
with normal hearing.
4 Conclusion
Although this audiometer is an experimental one, it is used in the Medical Engineering Laboratory of the Faculty of Product and Environment Design (Transylvania
University of Brasov).
This audiometer, although used only for didactic purposes within specialized
laboratories (construction and maintenance of medical devices, medical electronics,