

Research on Speech Changes Due to Environmental Noise
219
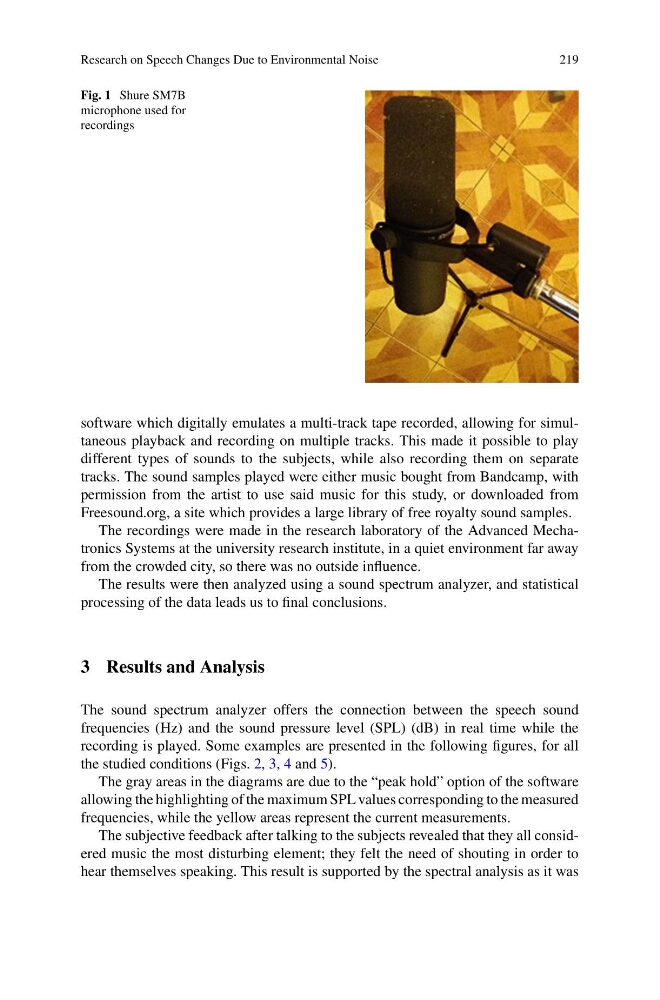
Fig. 1 Shure SM7B
microphone used for
recordings
software which digitally emulates a multi-track tape recorded, allowing for simultaneous playback and recording on multiple tracks. This made it possible to play
different types of sounds to the subjects, while also recording them on separate
tracks. The sound samples played were either music bought from Bandcamp, with
permission from the artist to use said music for this study, or downloaded from
Freesound.org, a site which provides a large library of free royalty sound samples.
The recordings were made in the research laboratory of the Advanced Mechatronics Systems at the university research institute, in a quiet environment far away
from the crowded city, so there was no outside influence.
The results were then analyzed using a sound spectrum analyzer, and statistical
processing of the data leads us to final conclusions.
3 Results and Analysis
The sound spectrum analyzer offers the connection between the speech sound
frequencies (Hz) and the sound pressure level (SPL) (dB) in real time while the
recording is played. Some examples are presented in the following figures, for all
the studied conditions (Figs. 2, 3, 4 and 5).
The gray areas in the diagrams are due to the “peak hold” option of the software
allowing the highlighting of the maximum SPL values corresponding to the measured
frequencies, while the yellow areas represent the current measurements.
The subjective feedback after talking to the subjects revealed that they all considered music the most disturbing element; they felt the need of shouting in order to
hear themselves speaking. This result is supported by the spectral analysis as it was
219
Fig. 1 Shure SM7B
microphone used for
recordings
software which digitally emulates a multi-track tape recorded, allowing for simultaneous playback and recording on multiple tracks. This made it possible to play
different types of sounds to the subjects, while also recording them on separate
tracks. The sound samples played were either music bought from Bandcamp, with
permission from the artist to use said music for this study, or downloaded from
Freesound.org, a site which provides a large library of free royalty sound samples.
The recordings were made in the research laboratory of the Advanced Mechatronics Systems at the university research institute, in a quiet environment far away
from the crowded city, so there was no outside influence.
The results were then analyzed using a sound spectrum analyzer, and statistical
processing of the data leads us to final conclusions.
3 Results and Analysis
The sound spectrum analyzer offers the connection between the speech sound
frequencies (Hz) and the sound pressure level (SPL) (dB) in real time while the
recording is played. Some examples are presented in the following figures, for all
the studied conditions (Figs. 2, 3, 4 and 5).
The gray areas in the diagrams are due to the “peak hold” option of the software
allowing the highlighting of the maximum SPL values corresponding to the measured
frequencies, while the yellow areas represent the current measurements.
The subjective feedback after talking to the subjects revealed that they all considered music the most disturbing element; they felt the need of shouting in order to
hear themselves speaking. This result is supported by the spectral analysis as it was