

214
4. Extract initial rates from the change in fluorescence (after subtracting the background fluorescence in the no enzyme control
at each substrate concentration) and plot against the concentration of the AI-domain peptide.
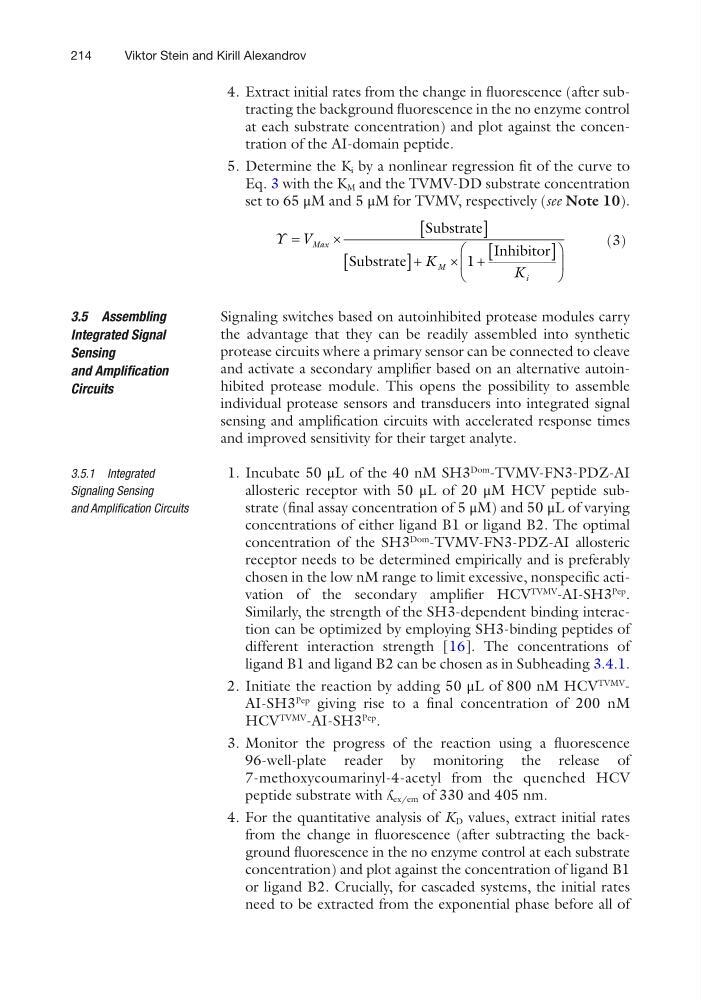
5. Determine the K i by a nonlinear regression fit of the curve to
Eq. 3 with the K M and the TVMV-DD substrate concentration
set to 65 μM and 5 μM for TVMV, respectively (see Note 10).
Y V
K
K
Max
M
i
=
´
[
]
[
]+ ´ + [
]
æ
è
ç
ö
ø
÷
Substrate
Substrate
Inhibitor
1
(3)
Signaling switches based on autoinhibited protease modules carry
the advantage that they can be readily assembled into synthetic
protease circuits where a primary sensor can be connected to cleave
and activate a secondary amplifier based on an alternative autoinhibited protease module. This opens the possibility to assemble
individual protease sensors and transducers into integrated signal
sensing and amplification circuits with accelerated response times
and improved sensitivity for their target analyte.
1. Incubate 50 μL of the 40 nM SH3
Dom
-TVMV-FN3-PDZ-AI
allosteric receptor with 50 μL of 20 μM HCV peptide substrate (final assay concentration of 5 μM) and 50 μL of varying
concentrations of either ligand B1 or ligand B2. The optimal
concentration of the SH3
Dom
-TVMV-FN3-PDZ-AI allosteric
receptor needs to be determined empirically and is preferably
chosen in the low nM range to limit excessive, nonspecific activation of the secondary amplifier HCV
TVMV
-AI-SH3
Pep
.
Similarly, the strength of the SH3-dependent binding interaction can be optimized by employing SH3-binding peptides of
different interaction strength [16]. The concentrations of
ligand B1 and ligand B2 can be chosen as in Subheading 3.4.1.
2. Initiate the reaction by adding 50 μL of 800 nM HCV
TVMV
-
AI- SH3
Pep
giving rise to a final concentration of 200 nM
HCV
TVMV
- AI- SH3
Pep
.
3. Monitor the progress of the reaction using a fluorescence
96-well-plate reader by monitoring the release of
7- methoxycoumarinyl-4-acetyl from the quenched HCV
peptide substrate with ʎ ex/em of 330 and 405 nm.
4. For the quantitative analysis of K D values, extract initial rates
from the change in fluorescence (after subtracting the background fluorescence in the no enzyme control at each substrate
concentration) and plot against the concentration of ligand B1
or ligand B2. Crucially, for cascaded systems, the initial rates
need to be extracted from the exponential phase before all of
3.5 Assembling
Integrated Signal
Sensing
and Amplification
Circuits
3.5.1 Integrated
Signaling Sensing
and Amplification Circuits
Viktor Stein and Kirill Alexandrov
4. Extract initial rates from the change in fluorescence (after subtracting the background fluorescence in the no enzyme control
at each substrate concentration) and plot against the concentration of the AI-domain peptide.
5. Determine the K i by a nonlinear regression fit of the curve to
Eq. 3 with the K M and the TVMV-DD substrate concentration
set to 65 μM and 5 μM for TVMV, respectively (see Note 10).
Y V
K
K
Max
M
i
=
´
[
]
[
]+ ´ + [
]
æ
è
ç
ö
ø
÷
Substrate
Substrate
Inhibitor
1
(3)
Signaling switches based on autoinhibited protease modules carry
the advantage that they can be readily assembled into synthetic
protease circuits where a primary sensor can be connected to cleave
and activate a secondary amplifier based on an alternative autoinhibited protease module. This opens the possibility to assemble
individual protease sensors and transducers into integrated signal
sensing and amplification circuits with accelerated response times
and improved sensitivity for their target analyte.
1. Incubate 50 μL of the 40 nM SH3
Dom
-TVMV-FN3-PDZ-AI
allosteric receptor with 50 μL of 20 μM HCV peptide substrate (final assay concentration of 5 μM) and 50 μL of varying
concentrations of either ligand B1 or ligand B2. The optimal
concentration of the SH3
Dom
-TVMV-FN3-PDZ-AI allosteric
receptor needs to be determined empirically and is preferably
chosen in the low nM range to limit excessive, nonspecific activation of the secondary amplifier HCV
TVMV
-AI-SH3
Pep
.
Similarly, the strength of the SH3-dependent binding interaction can be optimized by employing SH3-binding peptides of
different interaction strength [16]. The concentrations of
ligand B1 and ligand B2 can be chosen as in Subheading 3.4.1.
2. Initiate the reaction by adding 50 μL of 800 nM HCV
TVMV
-
AI- SH3
Pep
giving rise to a final concentration of 200 nM
HCV
TVMV
- AI- SH3
Pep
.
3. Monitor the progress of the reaction using a fluorescence
96-well-plate reader by monitoring the release of
7- methoxycoumarinyl-4-acetyl from the quenched HCV
peptide substrate with ʎ ex/em of 330 and 405 nm.
4. For the quantitative analysis of K D values, extract initial rates
from the change in fluorescence (after subtracting the background fluorescence in the no enzyme control at each substrate
concentration) and plot against the concentration of ligand B1
or ligand B2. Crucially, for cascaded systems, the initial rates
need to be extracted from the exponential phase before all of
3.5 Assembling
Integrated Signal
Sensing
and Amplification
Circuits
3.5.1 Integrated
Signaling Sensing
and Amplification Circuits
Viktor Stein and Kirill Alexandrov