

113
4. Record the fluorescence polarization signal using a suitable
plate reader.
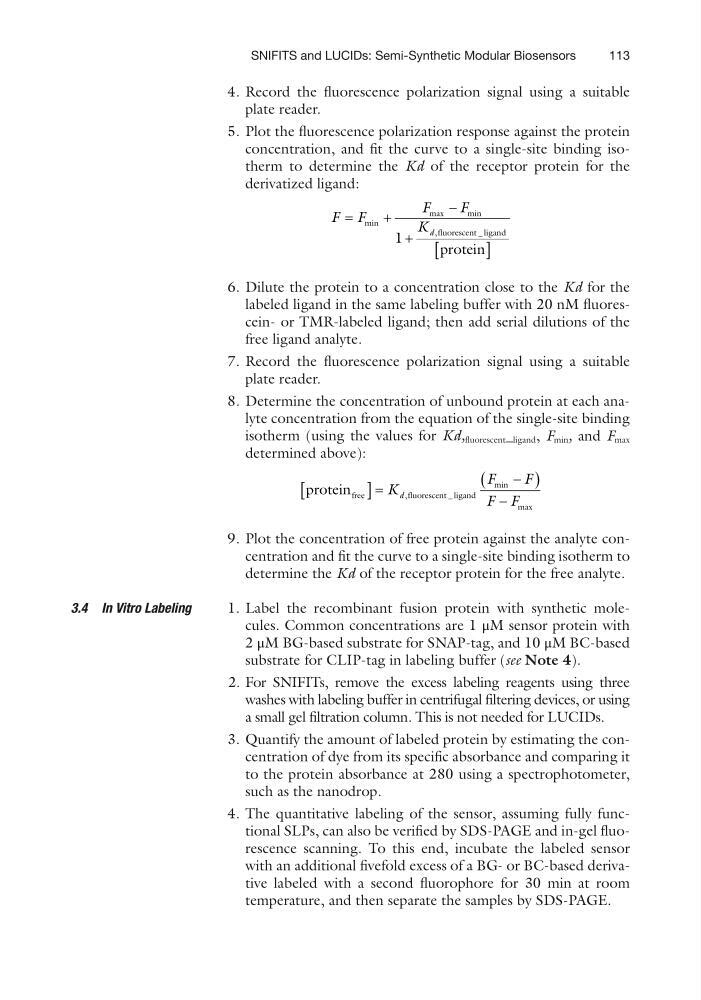
5. Plot the fluorescence polarization response against the protein
concentration, and fit the curve to a single-site binding isotherm to determine the Kd of the receptor protein for the
derivatized ligand:
F F
F
F
K d
=
+
-
+
[
]
min
max
m in
,
_
1
fluorescent ligand
protein
6. Dilute the protein to a concentration close to the Kd for the
labeled ligand in the same labeling buffer with 20 nM fluorescein- or TMR-labeled ligand; then add serial dilutions of the
free ligand analyte.
7. Record the fluorescence polarization signal using a suitable
plate reader.
8. Determine the concentration of unbound protein at each analyte concentration from the equation of the single-site binding
isotherm (using the values for Kd, fluorescent _ ligand , F min , and F max
determined above):
protein free
fluorescent ligand
[
]=
-
(
)
-
K
F
F
F F
d,
_
min
max
9. Plot the concentration of free protein against the analyte concentration and fit the curve to a single-site binding isotherm to
determine the Kd of the receptor protein for the free analyte.
1. Label the recombinant fusion protein with synthetic molecules. Common concentrations are 1 μM sensor protein with
2 μM BG-based substrate for SNAP-tag, and 10 μM BC-based
substrate for CLIP-tag in labeling buffer (see Note 4).
2. For SNIFITs, remove the excess labeling reagents using three
washes with labeling buffer in centrifugal filtering devices, or using
a small gel filtration column. This is not needed for LUCIDs.
3. Quantify the amount of labeled protein by estimating the concentration of dye from its specific absorbance and comparing it
to the protein absorbance at 280 using a spectrophotometer,
such as the nanodrop.
4. The quantitative labeling of the sensor, assuming fully functional SLPs, can also be verified by SDS-PAGE and in-gel fluorescence scanning. To this end, incubate the labeled sensor
with an additional fivefold excess of a BG- or BC-based derivative labeled with a second fluorophore for 30 min at room
temperature, and then separate the samples by SDS-PAGE.
3.4 In Vitro Labeling
SNIFITS and LUCIDs: Semi-Synthetic Modular Biosensors
4. Record the fluorescence polarization signal using a suitable
plate reader.
5. Plot the fluorescence polarization response against the protein
concentration, and fit the curve to a single-site binding isotherm to determine the Kd of the receptor protein for the
derivatized ligand:
F F
F
F
K d
=
+
-
+
[
]
min
max
m in
,
_
1
fluorescent ligand
protein
6. Dilute the protein to a concentration close to the Kd for the
labeled ligand in the same labeling buffer with 20 nM fluorescein- or TMR-labeled ligand; then add serial dilutions of the
free ligand analyte.
7. Record the fluorescence polarization signal using a suitable
plate reader.
8. Determine the concentration of unbound protein at each analyte concentration from the equation of the single-site binding
isotherm (using the values for Kd, fluorescent _ ligand , F min , and F max
determined above):
protein free
fluorescent ligand
[
]=
-
(
)
-
K
F
F
F F
d,
_
min
max
9. Plot the concentration of free protein against the analyte concentration and fit the curve to a single-site binding isotherm to
determine the Kd of the receptor protein for the free analyte.
1. Label the recombinant fusion protein with synthetic molecules. Common concentrations are 1 μM sensor protein with
2 μM BG-based substrate for SNAP-tag, and 10 μM BC-based
substrate for CLIP-tag in labeling buffer (see Note 4).
2. For SNIFITs, remove the excess labeling reagents using three
washes with labeling buffer in centrifugal filtering devices, or using
a small gel filtration column. This is not needed for LUCIDs.
3. Quantify the amount of labeled protein by estimating the concentration of dye from its specific absorbance and comparing it
to the protein absorbance at 280 using a spectrophotometer,
such as the nanodrop.
4. The quantitative labeling of the sensor, assuming fully functional SLPs, can also be verified by SDS-PAGE and in-gel fluorescence scanning. To this end, incubate the labeled sensor
with an additional fivefold excess of a BG- or BC-based derivative labeled with a second fluorophore for 30 min at room
temperature, and then separate the samples by SDS-PAGE.
3.4 In Vitro Labeling
SNIFITS and LUCIDs: Semi-Synthetic Modular Biosensors