

106
K
S
S
M
K
eff
d lig
1 =
é
ë
ù
û
é
ë
ù
û
=
(
)
(
)
open
closed
,
(1)
K
S
A
S
A
K d
2 =
é
ë
ù
û
é
ë
ù
û [ ]
=
(
)
(
)
open
open
analyte
,
(2)
K
K K
M
K
K
tot
eff
d lig
d
=
=
1
2
,
,analyte
(3)
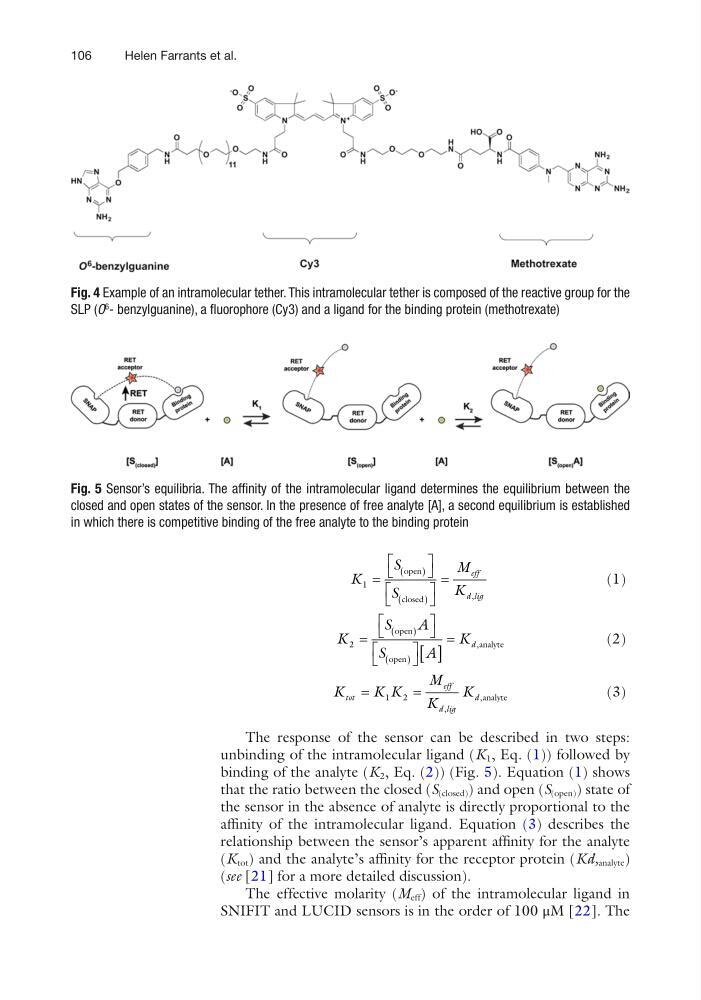
The response of the sensor can be described in two steps:
unbinding of the intramolecular ligand (K 1 , Eq. (1)) followed by
binding of the analyte (K 2 , Eq. (2)) (Fig. 5). Equation (1) shows
that the ratio between the closed (S (closed) ) and open (S (open) ) state of
the sensor in the absence of analyte is directly proportional to the
affinity of the intramolecular ligand. Equation (3) describes the
relationship between the sensor’s apparent affinity for the analyte
(K tot ) and the analyte’s affinity for the receptor protein (Kd, analyte )
(see [21] for a more detailed discussion).
The effective molarity (M eff ) of the intramolecular ligand in
SNIFIT and LUCID sensors is in the order of 100 μM [22]. The
Fig. 4 Example of an intramolecular tether. This intramolecular tether is composed of the reactive group for the
SLP (O
6
- benzylguanine), a fluorophore (Cy3) and a ligand for the binding protein (methotrexate)
Fig. 5 Sensor’s equilibria. The affinity of the intramolecular ligand determines the equilibrium between the
closed and open states of the sensor. In the presence of free analyte [A], a second equilibrium is established
in which there is competitive binding of the free analyte to the binding protein
Helen Farrants et al.
K
S
S
M
K
eff
d lig
1 =
é
ë
ù
û
é
ë
ù
û
=
(
)
(
)
open
closed
,
(1)
K
S
A
S
A
K d
2 =
é
ë
ù
û
é
ë
ù
û [ ]
=
(
)
(
)
open
open
analyte
,
(2)
K
K K
M
K
K
tot
eff
d lig
d
=
=
1
2
,
,analyte
(3)
The response of the sensor can be described in two steps:
unbinding of the intramolecular ligand (K 1 , Eq. (1)) followed by
binding of the analyte (K 2 , Eq. (2)) (Fig. 5). Equation (1) shows
that the ratio between the closed (S (closed) ) and open (S (open) ) state of
the sensor in the absence of analyte is directly proportional to the
affinity of the intramolecular ligand. Equation (3) describes the
relationship between the sensor’s apparent affinity for the analyte
(K tot ) and the analyte’s affinity for the receptor protein (Kd, analyte )
(see [21] for a more detailed discussion).
The effective molarity (M eff ) of the intramolecular ligand in
SNIFIT and LUCID sensors is in the order of 100 μM [22]. The
Fig. 4 Example of an intramolecular tether. This intramolecular tether is composed of the reactive group for the
SLP (O
6
- benzylguanine), a fluorophore (Cy3) and a ligand for the binding protein (methotrexate)
Fig. 5 Sensor’s equilibria. The affinity of the intramolecular ligand determines the equilibrium between the
closed and open states of the sensor. In the presence of free analyte [A], a second equilibrium is established
in which there is competitive binding of the free analyte to the binding protein
Helen Farrants et al.