

104
the need to excite the donor fluorophore. This eliminates problems with the autofluorescence of other molecules in the samples,
and eliminates the photo-toxicity and bleaching effects that may
take place when using FRET. Nevertheless, the photon count
emitted from the luciferase reaction is lower than that observed
when a fluorophore is excited, which makes FRET the readout
method of choice for applications in cell biology.
To quantify the response of the sensor to an analyte of interest,
the light intensity is measured at the emission wavelengths of both
RET partners (after excitation of the RET donor for SNIFITs or
after the addition of the luciferase substrate for LUCIDs). The
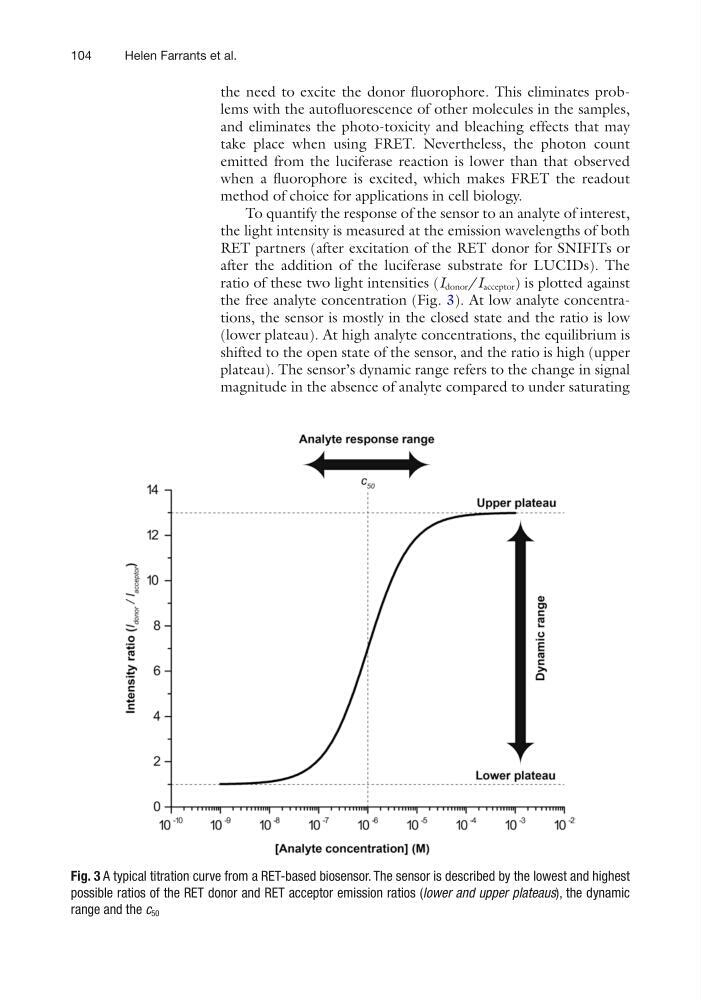
ratio of these two light intensities (I donor /I acceptor ) is plotted against
the free analyte concentration (Fig. 3). At low analyte concentrations, the sensor is mostly in the closed state and the ratio is low
(lower plateau). At high analyte concentrations, the equilibrium is
shifted to the open state of the sensor, and the ratio is high (upper
plateau). The sensor’s dynamic range refers to the change in signal
magnitude in the absence of analyte compared to under saturating
Fig. 3 A typical titration curve from a RET-based biosensor. The sensor is described by the lowest and highest
possible ratios of the RET donor and RET acceptor emission ratios (lower and upper plateaus), the dynamic
range and the c 50
Helen Farrants et al.
the need to excite the donor fluorophore. This eliminates problems with the autofluorescence of other molecules in the samples,
and eliminates the photo-toxicity and bleaching effects that may
take place when using FRET. Nevertheless, the photon count
emitted from the luciferase reaction is lower than that observed
when a fluorophore is excited, which makes FRET the readout
method of choice for applications in cell biology.
To quantify the response of the sensor to an analyte of interest,
the light intensity is measured at the emission wavelengths of both
RET partners (after excitation of the RET donor for SNIFITs or
after the addition of the luciferase substrate for LUCIDs). The
ratio of these two light intensities (I donor /I acceptor ) is plotted against
the free analyte concentration (Fig. 3). At low analyte concentrations, the sensor is mostly in the closed state and the ratio is low
(lower plateau). At high analyte concentrations, the equilibrium is
shifted to the open state of the sensor, and the ratio is high (upper
plateau). The sensor’s dynamic range refers to the change in signal
magnitude in the absence of analyte compared to under saturating
Fig. 3 A typical titration curve from a RET-based biosensor. The sensor is described by the lowest and highest
possible ratios of the RET donor and RET acceptor emission ratios (lower and upper plateaus), the dynamic
range and the c 50
Helen Farrants et al.